Basic Concepts
The Friedman test is a non-parametric alternative to ANOVA with repeated measures. No normality assumption is required. The test is similar to the Kruskal-Wallis Test. We will use the terminology from Kruskal-Wallis Test and Two Factor ANOVA without Replication.
Property 1: Define the test statistic
![]()
where k = the number of groups (treatments), n = the number of subjects, and Rj is the sum of the ranks for the jth group. If the null hypothesis is that the sum of the ranks of the groups are the same, then
![]()
when k ≥ 5 or n > 15. The null hypothesis is rejected when Q > 
Example
Example 1: A winery wanted to find out whether people preferred red, white, or rosé wines. They invited 12 people to taste one red, one white and one rose’ wine with the order of tasting chosen at random and a suitable interval between tastings. Each person was asked to evaluate each wine with the scores tabulated in the table on the left side of Figure 1.

Figure 1 – Friedman’s test for Example 1
The ranks of the scores for each person were then calculated and the Friedman statistic Q was calculated to be 1.79 using the above formula. Since p-value = CHISQ.TEST(1.79, 2) = 0.408 > .05 = α, we conclude there is no significant difference between the three types of wines.
Alternative Definition 1
Just as for the Kruskal Wallis test, an alternative expression for Q is given by
![]()
where 
For Example 1, we can obtain

Figure 2 – Alternative way of calculating Friedman’s statistic
Alternative Definition 2
An alternative definition for Q is
![]()
When ties in any column are present, the following adjusted form can be used
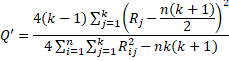
Here Rij is the rank of the ith element (row) in the jth group (column).
Finally, there is the following alternative test, based on the F distribution, which is more accurate
![]()
Worksheet Functions
Real Statistics Functions: The Real Statistics Resource Pack contains the following functions:
FRIEDMAN(R1, ties, chi) = value of Q on the data (without headings) contained in range R1 (organized by columns).
FrTEST(R1, ties, chi) = p-value of Friedman’s test on the data (without headings) contained in range R1 (organized by columns).
If ties = TRUE (default FALSE), then the ties corrected form is used, while if chi = TRUE (default) then the chi-square test form is used, while if chi = FALSE then the F test form is used.
For Example 1, FRIEDMAN(B5:D14) = 1.79 and FrTEST(B5:D14) = .408.
Observations
There is no commonly accepted measure of effect size, although Kendall’s W is often used (see Kendall’s Coefficient of Concordance). Note that Kendall’s W can be calculated from Friedman’s Q as follows:
![]()
Also used is the r coefficient for Kendall’s W, which is
![]()
In fact, it can be shown that r is the average (Spearman) correlation coefficient computed on the ranks of all pairs of raters.
See the following webpages for more information about Friedman’s test:
Dear Charles
Thank you for your site, it is a big help in doing statistics for my thesis.
I am trying to understand the adjusted formula for Q for tied data. I understand the Rj as the sum of ranks for the jth group, but I am having trouble understanding the Rij^2 in the denominator! Especially the ij part.
Can you help explain it?
Best wishes,
Ane
Hello Ane,
Rij^2 is the square of the rank of the ith element (row) in the jth group (column).
Charles
Dear Charles,
Thank you so much for your quick reply! Just to be completely clear, as I am still a bit unsure about what the ith row is, how would you calculate that? (or perhaps, which cell to choose/calculate in e.g. figure 1?)
Best wishes,
Ane
Dear Ane,
For example, R_8,3 refers the element in cell D11. The rank of this element appears in cell I11. Since the value in this cell is 3, the square of R_8,3 is 9.
R_ij is only used in Q’
Charles
Dear Charles,
Thank you very much for your help!
Best wishes,
Ane
Dear Dr. Charles,
I am very confused regarding which inferential statistical tests to apply to my data. Can I please get some guidance?
The objective of my research was to find answers to the following type of questions: I wanted to know whether the purchase intentions of individuals belonging to different demographic groups such as different genders, age groups, qualification levels, and occupations in two different countries are impacted in a similar or different way for 3 different types of digital marketing strategies (email marketing, food delivery apps, and social media marketing) that are personalized in 5 ways (name, current location, food preferences, nearest mealtime, birthdate for a deal). For eg do females in the UK respond differently to females in Pakistan for name-based personalization in a food delivery app? Or for example which age group responds best to or at least positively to location-based email marketing? To answer the above questions in my questionnaire I collected demographic data and then the respondents’ likelihood of clicking on the order now button from 1-7 (below are a few of my questions). These were replicated for the other two types of personalized digital marketing strategies.
5 Questions within my questionnaire for one type of digital marketing strategy:
1. If you see a perfect ad on one of the social media platforms that you use from a restaurant/foodservice provider that uses your name, how likely are you to click on the order-now button on the ad?
2. If you see a perfect ad on one of the social media platforms that you use from a restaurant/foodservice provider that uses your current location, how likely are you to click on the order-now button on the ad?
3. If you see a perfect ad on one of the social media platforms that you use from a restaurant/foodservice provider that uses your preferred foodtype based on previous order history, how likely are you to click on the order-now button on the ad?
4. If you see a perfect ad on one of the social media platforms that you use from a restaurant/foodservice provider that uses your nearest mealtime, how likely are you to click on the order-now button on the ad?
5. If you see a perfect ad on one of the social media platforms that you use from a restaurant/foodservice provider that uses your birthdate to offer you a deal, how likely are you to click on the order-now button on the ad?
To answer my research questions, I believe, I just needed to find out the Likert scale mode for each question (examples above) in all the demographic groups that I have, and whichever group’s response is the highest, will be the most responsive for that marketing strategy and personalization tactic. So my first question is, will that be enough?
Or, do I need to apply any statistical analysis technique that might make my analysis accurate? If I conduct inferential statistical analysis, I would need to compare two response sets: demographic data (that are categorical data); and data collected through the 7-point Likert Scale (which would either be categorical data, or continuous data, if we assume that 7-point Likert scale data can be labeled as continuous data). However, as you have seen above, all of these variables are being asked in a single statement, they aren’t being asked in separate sections. Hence, if I do need to conduct inferential statistical analysis, then I have the following questions:
Does all the data need to be tested for normality, linearity, and homoscedasticity? I already tested linearity and found that it isn’t normal, it is skewed). How do I perform the other two tests for the data that I have? Moreover, does that mean my data is non-parametric, and do I need to apply parametric or non-parametric tests to my data?
Do I need to perform log transformation to somehow transform my skewed distribution to normal distribution..and if yes using what as a base?? If yes, which of these should I use: 2, 10 or Natural as the base?
I have three data files in SPSS, one for respondents of the UK and one for respondents of Pakistan, and one for all respondents. I plan on applying the same tests on all three data sets, and then comparing their results…is that okay? For hypothesis testing, which of the non-parametric version of tests should I use such as the T Test (to compare means) or ANOVA or Chi-Square, or Spearman?
How can I test validity in SPSS…I didn’t find Confirmatory Factor Analysis in SPSS, I have heard it is available in AMOS and so downloaded it…should I use AMOS for that CFA testing or is there no need or another way in SPSS?
The tests I could understand most closely meeting my data set were the Chi-Square Test, Wilcoxon Rank Sum Test for Independent Samples, Fligner-Policello Test, and the Mann Whitney U Test. However, for Chi Square Test, the requirement for every cell to have a value greater than 5 is not being met currently. To meet the requirement of the Chi-Square Test, should I group the data in the 7-point Likert Scale first into 5 points and if the requirements are still not being met, then into 3 point scale, in questions where response option 4 (Value = Don’t Know), is greater than 5 so that I can at least apply the Chi-Square test in those questions? However, I am confused regarding which of these to apply.
Desperately looking forward to your guidance,
Dear N Farooque,
1. To answer my research questions, I believe, I just needed to find out the Likert scale mode for each question (examples above) in all the demographic groups that I have, and whichever group’s response is the highest, will be the most responsive for that marketing strategy and personalization tactic. So my first question is, will that be enough?
> This is enough if you just want the study to reflect the sample of subjects that have answered the questionnaire. If you want to generalize to a larger population, then you need to use inferential statistics.
2. Or, do I need to apply any statistical analysis technique that might make my analysis accurate?
> Statistical analysis (in the sense of inferential analysis) doesn’t provide accuracy, it allows you to generalize your results to a larger population
3. 7-point Likert Scale
> Often data from a 7-point Likert scale can be treated as continuous data
4. Does all the data need to be tested for normality, linearity, and homoscedasticity? …
> It depends on what tests you plan to use. E.g. if you use ANOVA, then there are assumptions of linearity, normality, etc. that need to be satisfied. Many of the tests are robust to some violations of these assumptions. How robust depends on many factors. If the violations are too severe, then a non-parametric test may be required. There are many such tests, including bootstrapping, which can be very useful in many situations.
5. Log transformation
Transformations can also be useful in dealing with violations of assumptions. The base of the log should matter since they are all constant multiples of one another.
6. Specific non-parametric tests
Which tests (chi-square, Mann-Whitney, etc.) to apply depends on what specific hypotheses you want to test. You need to define better what hypotheses you want to test.
7. Confirmatory Factor Analysis
Whether or not you even need to apply this depends on the details of your study.
8. It looks like you need more serious help in conducting your research. It would be best if you can identify someone locally who has the correct expertise, and preferably knowledge of your research project, who can give you some direction.
Charles
Dear Dr Charles,
Thanks for providing such quick and detailed guidance on these questions… much appreciated. And yes, I do have a meeting with my research supervisor in a few hours..so fingers crossed…But, thanks anyways for answering such a long list of questions.
Moreover, the following are my hypothesis:
H1: Personalized email marketing significantly impacts consumers’ purchase intentions.
H2: Personalization strategies used in Online/Mobile Food Delivery Apps significantly impact the consumers’ purchase intentions.
H3: Personalized social media marketing strategies significantly impact the consumers’ purchase intentions
So which test would you suggest to test these hypotheses?
Looking forward to your reply,
N Farooque
Hello Farooque,
If I remember correctly, you use a 7-point Likert scale to measure consumers’ purchasing intention. You have two values for each subject in the experiment: before and after. For each hypothesis, you can use a paired t-test. The key assumption is normality for the differences in the paired values. You can test this via Shapiro-Wilk, although if there are a lot of tied values some other test might be better (e.g. D’Agostino-Pearson). If this assumption fails, you should try using Wilcoxon’s Signed Ranks Test. These tests are described on the Real Statistics website. SPSS also provides such tests.
The key problem with this approach is experiment-wise error. Since you have so many hypotheses, you need to take this issue into account (e.g. via Bonferroni correction). With only 3 hypotheses you can use 3-way ANOVA to study the interaction between the three effects that you are testing for (if this is interesting to you). You can also use regression.
I hope that your research supervisor was helpful.
Dear Dr. Charles,
Many thanks for your analysis and guidance. I want your permission to put your name in the acknowledgment section of my dissertation if that is okay with you.
Meanwhile, I did check normality through the Shapiro-Wilk test and the results confirmed that my data was not normally distributed. Then I tested my hypothesis by grouping all my Likert statements for email marketing, then mobile food delivery applications, then social media and took out their average for each respondent. Next, I ran a One-Sample T-test to see whether the averages I had found earlier were statistically significant for each group of questions. I found all my hypotheses to be statistically significant.
Next, I am doing the Kruskal Wallis Test of Association to check which demographic group has a statistically significant relationship with each of the combinations of digital marketing strategy and personalization tactic (the question type that had Likert data). At the end of this part of the analysis, I am going to find the highest positive in that combination by creating tables with demographic variable options as rows and the Likert scale question’s response options as column headers with their frequencies (count) in the table cells. This way I will also find out the last type of questions I wanted to answer, regarding which demographic group responded the best to which combination.
I hope you understand what I am trying to do, while I have my fingers crossed as I don’t know whether I’m going in the correct direction.
However, happy happy holidays to your Sir,
Profoundest Regards
(P.S. Looking forward to your permission)
Dear N Farooque,
You certainly can acknowledge my name in your dissertation. This would be an honor for me, although my contribution was quite limited.
Regarding evaluating the approach you are taking, it seems more appropriate to consult your thesis supervisor since he should be more knowledgeable about your project.
Good luck with your thesis and happy holidays to you too.
Charles
Dear Dr Charles
I have a data sheet contain four time of measurements in two groups of control and treatment of 24 calves. Some data are not in normal distribution and didn’t normalize. How can I use Friedman test for one within and one between subjects?
Thank you for considering my question.
Dear Fatemeh,
Friedman’s test only handles one within-subjects group and no between-subjects group.
If the normality assumption was met you could use repeated measures ANOVA or repeated measures MANOVA.
Aligned Rank Transform ANOVA is a non-parametric approach to ANOVA with between-subjects factors. See
https://www.real-statistics.com/two-way-anova/aligned-rank-transform-art-anova/
Perhaps the three-factor version can be used to support the case that you are interested in, but I haven’t investigated this.
Some version of bootstrapping might also be useful, but I have not investigated this either.
Charles
Hi Charles,
I have 03 campaign plans for a product and 05 marketing areas randomly selected and assigned to each campaign plans. After campaign, 400 people were randomly selected from each area and their familiarity about the product were recorded which were not normally distributed. I want to test whether there is significant difference among the 03 population distributions from where these samples came? Pl advise whether to use Kruskal Wallis or Friedman test?
If you are testing differences between separate groups then Kruskal-Wallis seems to be the choice instead of Friedman’s test. If the homogeneity of variances assumption is not met, you might want to consider Welch’s ANOVA.
Charles
In the fig 1, where you are assigning the rank to the data. Isn’t the greater value should be assign a better rank. For example, in row 1, Isn’t white should be assigned rank 1. Please help me to understand if I am missing something?
Hello Binay,
I am using the version of ranking where the higher values get higher ranks. In this case, the lowest rank is 1.
Charles
Dear dr. Zaiontz,
I’m working in office 2003.
Is it possibel to perform a Friedman test wiyh post hoc by excel 2003? I’m not able to find the tool..
Thanks so much!
Paolo
Paolo,
I can’t recall whether Friedman’s test is supported, but I know that the post-hoc tests are not supported. You need a newer version of Excel for these.
Charles
Thank you so much for your reply, Charles!
It’s really time for me to get a change in my equipment…
I’m grateful to you for this data analysis tools: it’s a great resource!!
Best regards.
Paolo
Paolo,
Thank you for your kind remarks. Yes, Excel 2003 is no longer supported by Microsoft, and so it might be time to upgrade.
Charles
Dear Charles! Thank you for your site!
I have data that is similar to your wine example, but instead, I have 5 different wines, two of which are white, two are red and one is rose. I have 36 subjects, each one tried and rated on the 1-7 Likert scale all the 5 wines. Now I would like to disregard the specific wines and just answer the question, is there a difference between the three KINDS of wine (white, red, and rose)? So I want to collapse the 5 wines into 3 three factors: white, red, and rose, to see if the kind of wine makes the difference, how should I rank the data? I can’t just sum up the responses for each kind of wine because I have a different number of wines of each kind… So should I average the responses for each kind of wine (and then rank the results)? Thank you so much, Natasha
Hello Natasha,
For each subject, you can average the two white wines and average the two red wines. You can then use Friedman’s test.
An alternative approach is to randomly select one of the two white wines and one of the two red wines for each subject.
I can probably come up with other approaches, but which one to use depends on which fits best with your objective.
Charles
Dear Charles, thank you so much for your quick and informative response! You helped me a lot, and you solved my problem, Natasha