Tool Description
Real Statistics Data Analysis Tool: The Real Statistics Resource Pack supplies the Statistical Power and Sample Size data analysis tool. You can use this tool to determine the power that results from a statistical test for a specified effect size, sample size, and significance level (alpha). You can also use this tool to determine the minimum sample size required to achieve a specified effect size, power, and significance level.
To use this tool, press Ctrl-m and select Statistical Power and Sample Size (located on the Misc tab if using the Multipage user interface). The dialog box in Figure 1 will then appear.
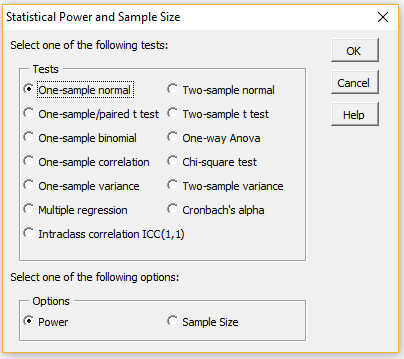
Figure 1 – Statistical Power and Sample Size dialog box
You can now select one of the specified thirteen tests and either the Power or Sample Size options.
Power
For example, if you choose the Two-sample t test and the Power options, you will be presented with the dialog box shown on the left side of Figure 2.
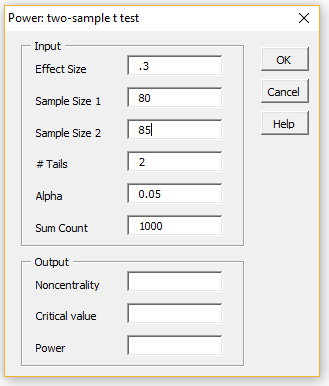
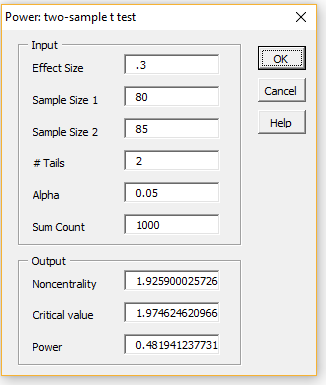
Figure 2 – Power: two-sample t-test dialog box
Next, fill in the Input fields, as shown on the left side of Figure 2 (retaining the default values of the # Tails, Alpha, and Sum Count fields). After pressing the OK button you will see the results shown in the Output portion of the dialog box, as shown on the right side of the figure.
We see from Figure 2 that the power of this test is 48.2% (we will explain the other output fields elsewhere). To increase the power of the test for the given effect size, you would normally need to change from a two-tailed to a one-tailed test, increase the sample size(s), increase the alpha value, or make some combination of these.
For this example, if you change the # Tails to 1, you would increase Power to 60.8%. If you require a two-tailed test, you would need to increase alpha to .28 to obtain power of at least 80%, which is usually not very acceptable. Alternatively, you could increase the sample sizes. E.g. to achieve a power of 80% you would need to increase the sample sizes to 176.
Sample Size
A sample size of 176 can be determined by trial and error, or more quickly by using the Sample Size option shown in Figure 1. You do this by first pressing the Cancel button (on the dialog box in Figure 2) or the × in the upper right-hand corner of the dialog box. When the dialog box shown in Figure 1 reappears, select the Sample Size option.
The dialog box shown on the left side of Figure 3 now appears. You need to insert .3 for the Effect Size and press the OK button. The result is shown on the right side of Figure 3, confirming that sample sizes of 176 are required. Note that the actual power achieved is a little more than 80%.
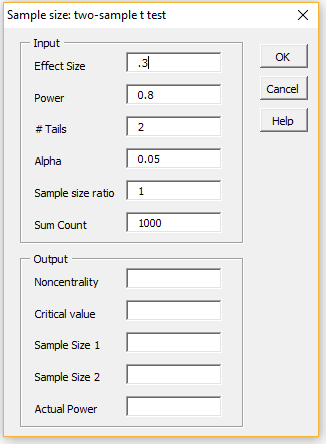
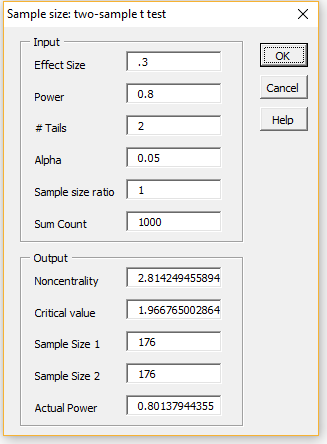
Figure 3 – Sample size: two-sample t-test dialog box
Note that the Sample size ratio is set to 1, which means that the ratio n2/n1 = 1 (where n1 = size of sample 1 and n2 = size of sample 2), i.e. the samples are equal. If we wanted the size of the second sample to be twice that of the first sample we would set Sample size ratio to 2.
We could also specify that sample 2 has a specific size, say 100, by using a negative value for Sample size ratio, -100 in this case. Note that if we fix n2, then to achieve power of 80% for the above example, we would need a larger sample 1. In particular, we would need sample 1 to have a size of at least 695.
Other Examples
We give many examples of how to carry out both the a priori and post hoc tests in Excel in many places on this website (see, for example, Statistical Power of the t-Tests, Power for One-way ANOVA, etc.).
Resources
If you need power and sample size capabilities beyond those provided by the Real Statistics Resource Pack there are software programs that can do this for you. One such program, G*Power, is available for free online.
References
Howell, D. C. (2010) Statistical methods for psychology, 7th Ed. Wadsworth. Cengage Learning
https://labs.la.utexas.edu/gilden/files/2016/05/Statistics-Text.pdf
Zar. J. H. (2010) Biostatistical analysis 5th Ed. Pearson
https://bayesmath.com/wp-content/uploads/2021/05/Jerrold-H.-Zar-Biostatistical-Analysis-5th-Edition-Prentice-Hall-2009.pdf
Faul, F., Erdfelder, E., Buchner, A., & Lang, A. G. (2009). Statistical power analyses using G*Power 3.1: Tests for correlation and regression analyses. Behavior Research Methods, 41, 1149-1160.
http://link.springer.com/article/10.3758/BRM.41.4.1149
STAT (2015) Power and sample size reference manual, release 13
http://www.stata.com/manuals13/pss.pdf
Is there an example how to calculate power/sample size estimates for an ICC? I can’t seem to find a manual anywhere. I want to compute sample size at 80% power but I am not sure what “#items” means…..it’s a continuous score
thanks!
Carol
Carol,
Please see the following webpage:
https://real-statistics.com/reliability/intraclass-correlation/intraclass-correlation-continued/
The # Items is actually labeled incorrectly. It should say # of Raters. This will be corrected in the next version of the software. Note that # of Raters = # of columns in the input data (referred to as k in the website text) and Sample Size = # of rows in the input data (referred to as n in the website text).
Thanks for bringing this issue to my attention so that I could improve the quality of the website.
Charles
Dear Dr. Charles,
I would like to have your comments about this experimental design.
I have to test the efficacy of a treatment on a single subject.
The device that measures the outcome variable performs a large number of measurements in a short period of time, but it returns only the mean and the standard deviation of all measurements, and the number of measurements on which this mean has been computed. So I have:
(mean1, sd1, n1) for condition A (pre-treatment)
(mean2, sd2, n2) for condition B (after treatment)
I understand that I can only perform a t-test between the two conditions to verify the null hypothesis that mean1 is statistically different from mean2;
but I don’t know which is the correct way to compute the power of the test.
I can set the measurement device to have n1=n2 to simplify computations.
Thank you very much for your help!
Piero
Piero,
If I understand correctly, the only data that you have are the following six statistics:
(mean1, sd1, n1) for condition A (pre-treatment)
(mean2, sd2, n2) for condition B (after treatment)
Is this correct? Did you use the paired t test?
Charles
Dear Charles,
yes these are the only data I have.
So I use the classical formula for t-test:
t = (mean1 – mean2)/sqrt((sqr(sd1)+sqr(sd2))/n)
by supposing n1=n2=n .
I don’t know how to apply a paired t-test to these data, by considering that I have only one subject and only these statistics that I reported.
Thank you again
Best Regards
Piero
Dear Charles,
please, could you give me some help about how to compute the statistical power for the particular test reported in my messages before?
I searched on my books and on the web for similar cases, but I am still quite confused, in effect I am even not sure if it is really possible to perform such computation!
Thank you very much for your help
Best Regards
Piero
Piero,
You can find information about the statistical power of the paired t test on the webpage
https://real-statistics.com/students-t-distribution/statistical-power-of-the-t-tests/
and using the Real Statistics Statistical Power and Sample Size data analysis tool.
Note that I still have doubts as to whether the paired t test is the correct test for your situation.
Charles
some how i am not being able to use this tool. the fig 1 is appearing on the screen but after that it does not work . please help.
Basundhara,
Please describe the problem in more detail.
Are you able to use other tools, but not this tool? Which version of Excel and Windows are you using? What do you see when you enter the formula =VER()
Charles
Hi
I performed a one way ANOVA and I did not get significant result.
Omega Square is 0.021
I need to calculate the required power using cohen’s F for the one way ANOVA to detect a significant result.
Using statistical power and sample size in real statistics tool, I did not quite understand (SUM COUNT) it set on 40, what does this number represent?
The value of the noncentral F distribution is based on an infinite sum. 40 represents the number of terms in the sum that are used to calculate the non central F distribution value.
Charles
Hi,
I’m trying to preform a power calculation for two samples with a normal distribution and I’m not sure what value should I enter in the Alpha field.
From my calculation when preforming an hypothesis test (N0 mean 1 = mean 2, N1 mean 1 – mean 2 > 0), my critical Z score for a 95% confidence level for a one tail test is 1.64, and my actual Z score of the difference between the means is 1.38, meaning I do not reject the null hypothesis.
The P value for 1.38 is 8.24% of committing a type I error.
Do I need to enter 0.05 for the alpha or should I enter 0.0824?
English is not my native language so I hope I managed to translate the statistical terms correctly.
Thanks!
Ori
Ori,
When using the Power and Sample Size data analysis tool you would use alpha = .05.
Charles