Basic Concepts
We will now extend the method of least squares to equations with multiple independent variables of the form
![]()
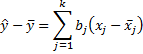
As in Method of Least Squares, we express this line in the form
![]()
Thus,
Given a set of n points (x11, …, x1k, y1), … , (xn1, …, xnk, yn), our objective is to find a line of the above form which best fits the points. As in the simple regression case, this means finding the values of the bj coefficients for which the sum of the squares, expressed as follows, is minimum:

where ŷi is the y-value on the best-fit line corresponding to x, …, xik.
Definition 1: The best-fit line is called the (multiple) regression line

Key Property
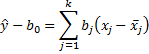
Property 1: The regression line has the form
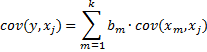
where the coefficients bm are the solutions to the following k equations in k unknowns.
Click here for a proof of Property 1 (using calculus).
We can use either the population or sample formulas for covariance (as long as we stick to one or the other). Thus, we can use the Excel function COVAR for the population covariance (or COVARIANCE.P in versions of Excel starting with Excel 2010) or COVARIANCE.S for the sample covariance in versions of Excel starting with Excel 2010 (or the Real Statistics function COVARS), although as we will see below there are ways of calculating all the covariances together. Note too that where j = m
![]()
Regression example
Example 1: A jeweler prices diamonds on the basis of quality (with values from 0 to 8, with 8 being flawless and 0 containing numerous imperfections) and color (with values from 1 to 10, with 10 being pure white and 1 being yellow). Based on the price per carat (in hundreds of dollars) of the following 11 diamonds weighing between 1.0 and 1.5 carats, determine the relationship between quality, color and price.

Figure 1 – Data for Example 1
As described above, we need to solve the following equations:
![]()
![]()
where x1 = quality and x2 = color, which for our problem yields the following equations (using the sample covariances that can be calculated via the COVAR function as described in Basic Concepts of Correlation):
![]()
![]()
For this example, finding the solution is quite straightforward: b1 = 4.90 and b2 = 3.76. Thus the regression line takes the form
![]()
Using the means found in Figure 1, the regression line for Example 1 is
(Price – 47.18) = 4.90 (Color – 6.00) + 3.76 (Quality – 4.27)
or equivalently
Price = 4.90 ∙ Color + 3.76 ∙ Quality + 1.75
Thus, the coefficients are b0 = 1.75, b1 = 4.90 and b2 = 3.76.
Observations
The fact that coefficient b1 is larger than b2 doesn’t mean that it plays a stronger role in the prediction described by the regression line. If, however, we standardize all the variables that are used to create the regression line, then indeed the coefficients that have a larger absolute value do have a greater influence on the prediction defined by the regression line. Note that if we do this the intercept will be zero.
With only two independent variables, it is relatively easy to calculate the coefficients for the regression line as described above. With more variables, this approach becomes tedious, and so we now define a more refined method.
Covariance Matrix
Definition 2: Given m random variables x1, x2, …, xm and a sample x1j, x2j, …, xnj of size n for each random variable xj, the covariance matrix is an m × m array of the form [cij] where cij = cov(xi, xj). The correlation matrix is an m × m array of the form [cij] where cij is the correlation coefficient between xi and xj.
The sample covariance matrix is the covariance matrix where the cij refer to the sample covariances and the population covariance matrix is the covariance matrix where the cij refer to the population covariances.
Since the corresponding sample and population correlation matrices are the same, we refer to them simply as the correlation matrix.
Property 2: If X is the n × m array [xij] and x̄ is the 1 × m array [x̄j], then the sample covariance matrix S and the population covariance matrix Σ have the following property:
![]()
![]()
Example using covariance matrix
Example 2: Find the regression line for the data in Example 1 using the covariance matrix.
The approach is described in Figure 2.

Figure 2 – Creating the regression line using the covariance matrix
The sample covariance matrix for this example is found in the range G6:I8. Since we have 3 variables, it is a 3 × 3 matrix. In general, the covariance matrix is a (k+1) × (k+1) matrix where k = the number of independent variables. The sample covariance matrix can be created in Excel, cell by cell using the COVARIANCE.S or COVARS function. Alternatively, using Property 2, we can create it by highlighting the range G6:I8 and using the following array formula:
=MMULT(TRANSPOSE(A4:C14-A15:C15),A4:C14-A15:C15)/(B17-1)
(see Matrix Operations for more information about these matrix operations). The sample covariance matrix can also be created using the following array function (as described below):
=COV(A4:C14)
Using Excel functions
Note that the linear equations that need to be solved arise from the first 2 rows (in general, the first k rows) of the covariance matrix, which we have repeated in the range G12:I13 of Figure 2.
Solving this system of linear equations is equivalent to solving the matrix equation AX = C where X is the k × 1 column vector consisting of the bj, C = the k × 1 column vector consisting of the constant terms, and A is the k × k matrix consisting of the coefficients of the bi terms in the above equations. Using the techniques of Matrix Operations and Simultaneous Linear Equations, the solution is given by X = A-1C. For this example the solution A-1C is located in the range K16:K17, and can be calculated by the array formula:
= MMULT(MINVERSE(F16:G17),I16:I17))
Thus b1 is the value in cell K16 (or G20) and b2 is the value in cell K17 (or G21). The value of the coefficient b0 (in cell G19) is found using the following Excel formula:
=C15-MMULT(A15:B15,G20:G21)
Worksheet Functions
Real Statistics Functions: The Real Statistics Resources Pack provides the following array functions:
COV(R1, b) = the covariance matrix for the sample data contained in range R1, organized by columns. If R1 is a k × n array (i.e. k variables, each with a sample of size n), then COV(R1) must be a k × k array.
COVP(R1, b) = the population covariance matrix for the data contained in range R1. The result is the same as COV(R1) except that entries use the population version of covariance (i.e. division by n instead of n – 1).
CORR(R1, b) = the correlation matrix for the data contained in range R1.
If b = TRUE (default) then any row in R1 which contains a blank or non-numeric cell is not used, while if b = FALSE then correlation/covariance coefficients are calculated pairwise (by columns) and so any row which contains non-numeric data for either column in the pair is not used to calculate that coefficient value.
Data Analysis Tool
The Real Statistics Resource Pack also contains a Matrix Operations data analysis tool that includes similar functionality to the above worksheet functions.
Excel equivalents
Let R1 be a k × n range that contains only numeric values, let R2 be a 1 × n range containing the means of the columns in R1, and let R3 be a 1 × n range containing the standard deviations of the columns in R1. Then
COV(R1) = MMULT(TRANSPOSE(R1-R2),R1-R2)/(ROWS(R1)–1)
CORR(R1) = MMULT(TRANSPOSE((R1-R2)/R3),(R1-R2)/R3)/(ROWS(R1)–1)
Hi Charles
As well as other comments I’ve saw, I find myself struggling trying to solvevariables in an equation formatted like z = Ax^3 + By^3 + Cyx^2+ Dxy^2… + Hx + Iy + J, where every letter from A to J are the unknown variables. I have exactly 29 points where (x, y, z) are known (as temperatures) in relation to each other. I am really having a hard time doing the covariance matrix for the problem and finding the equation. Would you have a suggestion on how to proceed? Or should I find a new method?
Hello Frank,
If you send me an Excel file with your data and the regression analysis that you tried, I will give you my input about what has gone wrong.
Charles
Hello Charles,
I am currently trying to solve two variables in an equation formatted like z = xK + yU, where K and U are the unknown variables. I have 19 points where (x, y, z) are known in relation to each other. I am struggling on how to form the covariance matrix for this system. I attempted copying the equation listed with no success. Would you have a suggestion on how to proceed? Or if this method is viable for my situation?
Sincerely,
Damian
Damian,
This webpage explains how to calculate the covariance matrix, and so without knowing what sort of problems you are having, it is difficult for me to make any suggestions. If you email me an Excel file with your data for a, y and z and your attempts at calculating the covariance matrix, I will try to figure out what is going wrong.
Charles
Hello Charles,
Thank you so much for your valuable and very useful website. Can the Real Statistics package handle a fixed effects regression model? I need to include firm and time fixed effects in a OLS regression model.
Thanks,
Anthony
Anthony,
Yes
Charles
Hi Charles
I need an online calculator for ordianry least squares.I have two independent variables and one dependent variables
Real Statistics doesn’t provide an online calculator, but it will perform ordinary least squares regression. You need to download the software to use it. Standard Excel can also be used: in particular, the Data Analysis Toolpak.
Charles
hello Charles.
I want to ask. to find the covariance matrix in the above table using cov according to the above formula. however, how to find -2.1. 20.5 and 15.34545. i have trouble to find it. please help me. thanks
Hi Charles, regarding your example with the covariance matrix, where is No derived from?
I don’t see it listed
Jonathan,
Sorry, but I don’t see what “No” you are referring to. Also which example are you referring to?
Charles
Charles, you write:
For this example, finding the solution is quite straightforward: b1 = 4.90 and b2 = 3.76. Thus the regression line takes the form
What is the straightforward way that this is done? I’m not sure. Thank you.
Jonathan,
The approach is to solve the stated two simultaneous equations in two unknowns using elementary algebra.
Charles
Thank you for the good explenations on all of these pages on this website! 🙂
However, I am struggeling with the covariance matrix…
When I am using the COVARIANCE.S option to caluculate the covariance matrix cell by cell I get the values that are given in Figure 2 for the covariance matrix.
However, when I am using the covariance tool in the data pack, I get other values (input = cells with the values for color, quality and price for each sample (A4:C14) and group per column) .
And when I highlight the range and use the formula: =MMULT(TRANSPOSE(A4:C14-A15:C15),A4:C14-A15:C15)/(B17-1) Excel gives an error that this cannot be calculated.
The array function COV is not known by my Excel (I downloaded and installed all the packages) and I therefore I cannot use this as well….
Brigitte,
The formula =MMULT(TRANSPOSE(A4:C14-A15:C15),A4:C14-A15:C15)/(B17-1) is an array formula, and so you must highlight a 3 x 3 range, enter the formula and press Ctrl-Shft-Enter.
COV is not an Excel function. It is provided by the Real Statistics addin. You would need to install this software, which you can download for free from the Real Statistics website.
Charles
Hello Charles,
Thanks again for the fast reply!
The Ctrl-Shft-Enter (instead of Enter) was the trick… 🙂
However, should this not give the same outcome as the covariance tool in the data pack?
I activated the Real Statistics addin, but cannot find the COV function. Can it have something to do that my Excel is in Dutch and not in English?
Thanks!
Brigitte
Brigitte,
When using the Real Statistics COV function in Excel 2010/2011/2013/2016, you should see it in the list of functions as you type the letters C, O, V. This is not the case when using Excel 2007. In any case, the function is available for Excel 2007 users.
The function will still be called COV when using the Dutch version of Excel.
The results from the COV function should be the same as Excel’s covariance data analysis tool.
Charles
I am using Excel 2010, but I don’t see the function. So, I have to fix that problem first… (I only see Covariance.P and Covariance.S)
I had to unblock first…
https://real-statistics.com/real-statistics-environment/accessing-supplemental-data-analysis-tools/
Sir,
In the paragraph directly below figure 2, should it read that k is equal to the number of ‘independent’ variables?
Thanks
Steve
Steve,
Thanks for catching this mistake. I have now made your suggested change.
I appreciate your help in improving the website.
Charles
Charles,
In my particular problem, I’m working with as many as 17 independent variables. As part of my analysis, I’d like to recalculate the b coefficients using a subset of those independent variables. Currently, I have to reconstruct your worksheet shown in Figure 2 for each subset (e.g., rebuild all the equations for 12, 10 or 8 independent variables). Is there either an Excel trick or (better yet) mathematical way to null out the impact of an independent variable?
Thanks,
Steve
Steve,
I don’t know of such a trick, but I frankly haven’t tried to spend any time thinking of one.
It is easier to do the analysis you are describing using Excel’s Regression data analysis tool or the Real Statistics Multiple Regression data analysis tool. The stepwise regression option may also be helpful.
Charles
Esteemed professor:
A question more on a Mathematical bent, if I may:
When you are expressing Cov(y,xj) as a sum over Cov(xm, xj) , are you using or making reference to some underlying vector space structure with basis { Cov(xm, xj)}?
Thanks.
Gary,
Sorry, but I don’t see where I am expressing Cov(y,xj) as a sum over Cov(xm, xj).
Charles
Sorry for not being clear, I was referring to the second formula below the statement of theorem 1 :
Cov(y,xj)=Sum_m=1…k Cov(xj, xm)
Hi Charles,
Say I have a regression Y with respect to X1, X2, X3. I regress Y with respect to each
of X1, X2, X3 and in each case my slope is negative. Does it follow that if I regress Y with respect to X1,X2 and X3, the coefficients Beta1, Beta2, Beta3 should all be negative if the Xi’s have been standardized?
Thanks.
Probably not, but I don’t know for sure. You could a few examples yourself to see whether this is true or not.
Charles
Charles,
Can’t thank you enough for the information. Question for you: I’d like to perform a weighted MLE in Excel (minimizing the weighted squared error with weights I define) without using an add-in (I have to share the sheet with various users who will not all be able to install outside software). I was cheating and using solver but I’m finding it is giving me unusual (and often incorrect) answers. I figured out how to do it mathematically for an OLE but I’m stumped on how to do it for an MLE. Can you help?
Bonus question: is there also a way to do it with constraints on the variables? For example, say in B1 x X1 +B2 x X2 + B3 I want B1 >=1, B2 >=0, and B3 >=0.
Thanks!
Ethan
Ethan,
You should be able to use Solver for this. If you send me an Excel file with your data and analysis I will try to understand why Solver is giving unusual results.
See also the following webpage regarding how to perform weighted linear regression.
Weighted Linear Regression
Charles
How would you standardize the variables to see which ones have a greater influence on the prediction?
Jack,
You can standardize the data for each variable by using Excel’s STANDARDIZE function (based on the mean and std dev for each variable), but this won’t tell you which variable have the greater influence on the prediction. You can use the Shapley-Owen decomposition for this. See the following webpage for details
https://real-statistics.com/multiple-regression/shapley-owen-decomposition/
Charles
Couldn’t we conclude that the variable with the largest coefficient in absolute value (maybe after standardizing) has the most weight (given the interpretation of \Beta_i as the change in Y for every unit change in X_i)?
I don’t believe this is true. You can use Shapley-Owens to find the coefficient with the most weight. See
Shapley-Owen Decomposition
Charles
Hi, please why are linear and multiple regression called “least square” regression? And why do we calculate confidence interval for slope and intercept?
Aloysius,
This is because the regression algorithm is based on finding coefficient values that minimize the sum of the squares of the residuals (i.e. the difference between the observed values of y and the values predicted by the regression model) – this is where the “least squares” notion comes from.
You don’t need to calculate confidence intervals for the slope(s) and intercept, but the idea here is to find the range of probable values for the real slopes and intercept (by real I mean the population values of these parameters). If the confidence interval for the slope (or intercept) contains zero, then statistically speaking you can assume that that slope (or intercept) value is zero, i.e. can be removed from the model.
Charles
sir how to analysis the use in categorical predictor variables .
eg: gender(male/female), area(urban/village)…. etc
using these predictor variables how to develop the multiple linear regression model , response variable is student mathematics marks. sir can you give me to the idea. thank you sir
Hi,
Thanks a lot for the nice detailed explanation.
One question, what does the final regression line look like in the Example 2?
Thanks!
See Example of the webpage Multiple Regression Analysis in Excel.
Charles
Just wanted to thank you for these web sites.
In general I would say these are probably the best web sites I have ever come across with!
Best Regards,
Oskari
Oskari,
Thank you very much. I am very pleased that you like the website.
Charles
Can anyone please help me out in solving the following problem:
35.36αul + 1.16Xul + 34.2ωul = 19.41
Need to find out values ofαul , Xul, and ωul = 0.
That will satisfy the equations closely
an early response would be much appreciated.
There are an infinite number of exact solutions to the equation that you have given. There are no solutions where αul = 0, Xul = 0 and ωul = 0.But I don’t think this is the intended question. Please explain better what you are looking for.
Charles
Can you please explain the following:
For this example, finding the solution is quite straightforward: b1 = 4.90 and b2 = 3.76.
How did you end up with the factors for b1 and b2, 4.9 and 3.76, respectively.
Stan,
This is explained on the referenced webpage. Essentially you generate the following two linear equations
20.5 = 5.80b1 – 2.10b2
15.35 = -2.10b1 + 6.82b2
and then you find the solution using high school algebra. E.g. if you multiply the first equation by 2.10 and multiply the second equation by 5.80 and then add the two equations together, the b1 term will drop out and you can solve the resulting equation for b2. Once you have the value for b2, you can substitute it in the first equation and solve for b1.
Charles
Hi Charles,
I made the calculations of the equations below figure 1 and i found that there is a trouble… the result of my calculation is
20.5 =5.8b1 -2.1b2
15.34 = -2.1b1 – 6.82b2
S0, cov(y,x1)= 15,34, cov(x1,x2)=-2.10, cov(x1,x1)=6.82, cov(x2,x2)= 5.8
and cov(y,x2)= 20,5
with color=x2 and quality= x1 (as you say in the start of the text)
Are there any mistakes int he equations?
Everything looks good except that you made typo in the second equation. It should be 15.34 = -2.1b1 + 6.82b2.
Charles
Good, clearly written approach – thanks!
Thank you for the formulas. My textbook and Prof ( for online course) are both useless. This helped a lot and I was actually able to do my assignment. Appreciate it!!
Thanks a lot for this website! Really helped a lot..
Hi Charles, do you have a matlab code for the least square with an example?
Hi Emrah,
Sorry, but I don’t have matlab code for the least square. Examples using Excel can be found on my website.
Charles
I do if it is still no too late. There is also a lot of regression add-ons for matlab on the File Exchange. Let me know and good luck
Hi Charles,
Just wanted to say a massive thank you for creating this whole site. It has fantastically written pieces with the relevant mathematically formulations for those who wish to fully understand the processes and brilliant examples for those who just wish to use them. I wished to do both so to have both in one place in depth is invaluable.
Many, many thanks,
Josh
Josh,
I really appreciate your comment and am very pleased that you have benefitted from the website.
Charles
Hi,
sir how you found 20.5= 5.80b1-2.10b2 from figure 1 by using the equation
cov(y,x1)=b1 cov(x1,x1)+b2 cov(x2,x1)
You have only written one equation, but there are two equations, not just one. In fact there are two linear equations in two unknowns. The coefficients b1 and b2 are the unknowns, the values for cov(y1,x1), cov(x1,x2), etc. are known (they can be calculated from the sample data values). Normal algebra can be used to solve two equations in two unknowns. With more equations and more unknowns you can still use algebra, but you can also use the techniques shown elsewhere on the site. Charles