In Multiple Correlation we explore correlations with three random variables. We now extend some of these results to more than three variables.
Correlation Coefficient and Coefficient of Determination
First, we summarize some of the results from Multiple Regression Analysis about the correlation coefficient and coefficient of determination for any number of variables. In particular, the coefficient of determination can be calculated by
![]()
The Real Statistics Resource Pack provides the array function RSquare(R1, R2) which computes R2. Here R1 is an n × k array containing the X sample data and R2 is an n × 1 array containing the Y sample data.
Thus, we can calculate the correlation coefficient by the formula =SQRT(RSquare(R1, R2)).
Alternatively, we can calculate both the correlation coefficient and coefficient of determination using either Excel’s Regression data analysis tool or the Real Statistics Linear Regression data analysis tool.
Another use of RSquare
As described in Multiple Regression Analysis, there is also a second form of the RSquare function in which RSquare(R1, j) = R2 where the X data contains all the columns in R1 except the jth column and the Y data consists of the jth column of R1.
Thus if R1 is an n × k array consisting of all the X data followed by a column of Y data, then R2 = RSquare(R1, k).
In particular, suppose that R1, R2, and R3 are the three columns of the n × 3 array R. We further assume that R1 and R2 contain the sample data for the independent variables x1 and x2 and R3 contains the sample data for the dependent variable y. It follows that the array formulas =MCORREL(R3, R1, R2) and =SQRT(RSquare(R, 3)) produce the same results.
Property of R2
It turns out that R2 = RSquare(R1, j) can also be calculated by first finding the inverse of the correlation matrix for R1 and then selecting the jth element on the diagonal. If this has the value c, then the desired value of R2 is 1 – 1/c.
Thus, R2 can also be calculated by the formula:
=1–1/INDEX(DIAG(MINVERSE(CORR(R1))), j)
Partial Correlation Coefficient
Definition 1: Suppose that we have random variables x1, …, xk and for each xj we have a sample of size n. Now suppose that Z consists of all the random variables x1,…, xk excluding xi and xj where i ≠ j. Then the partial correlation coefficient between variables xi and xj is the correlation coefficient between xi and xj controlling for all the other variables (i.e. keeping all the variables in Z constant).
This definition is consistent with Definition 3 of Multiple Correlation where there are only three variables (i.e. k = 3). It turns out that the partial correlation coefficient can be calculated as described in the following property.
Partial Correlation Property
Property 1: Suppose that x1, …, xk and Z are as in Definition 1, and let X be the n × k matrix X = [xij]. The partial correlation coefficient between variables xi and xj where i ≠ j controlling for all the other variables is given by the formula
![]()
where the inverse of the correlation matrix R of X is R-1 = [pij].
Example
Example 1: Calculate the partial correlation coefficient between Crime and Doctor controlling for Traffic Deaths and University based on the data in Figure 1 (which is a subset of the data for Example 1 of Multiple Correlation).
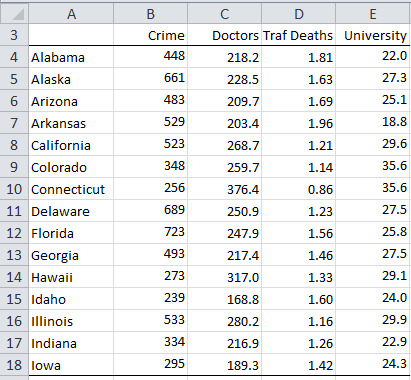
Figure 1 – US State Data
First, we calculate the correlation matrix and its inverse for the data in Figure 1 (see Figure 2).

Figure 2 – Inverse of Correlation Matrix
The correlation matrix in range H4:K7 can be calculated as described in Multiple Regression Least Squares. We can then calculate the inverse of the correlation matrix (range H11:K14) via the worksheet formula =MINVERSE(CORR(B4:E18)).
We can now calculate the partial correlation coefficient between Crime and Doctors, controlling for Traffic Deaths and University, using Property 1. In particular, we use the formula =–I11/SQRT(H11*I12), yielding a value of 0.0919913.
In general, the partial correlation coefficient between the ith and jth variables is given by the formula
=INDEX(-H11:K14/MMULT(M11:M14,TRANSPOSE(M11:M14)), i, j)
or alternatively, the following formula which is less resource-intensive to calculate:
=INDEX(-H11:K14/(M11:M14*TRANSPOSE(M11:M14)), i, j)
Here the range M11:M14 represents the square root of the elements on the diagonal of the inverse of the correlation matrix. This can be calculated using the array formula
=SQRT(INDEX(H11:K14,G11:G14,G11:G14))
Or alternatively the array formula =SQRT(DIAG(H11:K14).
Observation: As described above, we can calculate R2C,DTU using any of the following formulas to get the value .103292:
=RSquare(C4:E18,B4:B18)
=Rsquare(B4:E18,1)
=1-1/H11
Partial Correlation Matrix
Definition 2: Suppose that x1, …, xk and X are as described in Definition 1 and Property 1. Then the partial correlation matrix of X is the k × k matrix S = [sij] where for all i ≠ j
![]()
Example 2: Calculate the partial correlation matrix for the data in Figure 1.
The result is shown in Figure 3.

Figure 3 – Partial Correlation Matrix
The partial correlation matrix in range H19:K22 is calculated using the array formula
=-H11:K14/(M11:M14*TRANSPOSE(M11:M14))
Observation: Note that Definition 2 does not define the values on the diagonal of the partial correlation matrix (i.e. where i = j). The formula above results in a matrix whose main diagonal consists of minus ones. If we prefer to have the main diagonal consist of all ones, we can use the following modified formula:
=-H11:K14/(M11:M14*TRANSPOSE(M11:M14))+2*IDENTITY()
Worksheet Functions
Real Statistics Functions: The Real Statistics Resource Pack provides the following functions where R1 is an n × k matrix representing samples of size n for the random variables x1,…, xk.
PCORREL(R1, i, j) = the partial correlation coefficient of xi with xj based on the data in R1
PCORR(R1) is an array function that outputs the partial correlation matrix for the data in R1
For the data in Figure 1, PCORREL(B4:E18, 1, 2) = 0.0919913 of Figure 3. Furthermore, the values in H19:K22 could be calculated by the array formula =PCORR(B4:E18 except that the main diagonal would contain ones.
Examples Workbook
Click here to download the Excel workbook with the examples described on this webpage.
References
Wikipedia (2014) Partial correlation
https://en.wikipedia.org/wiki/Partial_correlation
Heckert, A. (2013) Partial correlation matrix. National Institute of Standards and Technology, Datapoint
https://www.itl.nist.gov/div898/software/dataplot/refman2/auxillar/matrpaco.htm#:~:text=Description%3A,j%20of%20the%20original%20matrix.
Using Excel 2010, even though my values in the data table (A3:E18), Correlation Matrix (H4:K7), Inverse of Correlation Matrix (H11:K14) and Sqrt Diag table (M11:M14) appear to match yours (to the precision that you show in Figures 1 and 2), my values in the Partial Correlation Matrix (H19:K22) differ.
Are the values shown in the webpage (Figure 3) correct? For what Excel version?
My values are:
Crime Doctors Traf Deaths University
Crime -1.0000000 0.0919913 0.2744550 0.0747844
Doctors 0.0919913 -1.0000000 -0.2646825 0.4036024
Traf Deaths 0.2744550 -0.2646825 -1.0000000 -0.6248813
University 0.0747844 0.4036024 -0.6248813 -1.0000000
Interestingly, my value for Doctors and Crime appears to be the same as the webpage value in the sentence: “we use the formula =–I11/SQRT(H11*I12), yielding a value of 0.0919913“.
In my Excel file, the array-entered formula in H19:K22 is unchanged, namely:
{ =-H11:K14/MMULT(M11:M14,TRANSPOSE(M11:M14)) }
Thata is similar to the INDEX(…,i,j) formula that appears in the webpage.
The alternative array-entered formula in H27:K30 is also unchanged. And it returns the same values (to 15 significant digits). It is the same as the formula that appears in the webpage following Figure 3, namely:
{ =-H11:K14/(M11:M14*TRANSPOSE(M11:M14)) }
Hello Ken,
Thanks for identifying this error.
The partial correlation matrix described in the Examples Workbook that you can download from this webpage is correct, but the matrix displayed in Figure 3 is not correct. I have now corrected this error on the webpage.
I really appreciate your help in improving the accuracy of the website.
Charles
You’re welcome. Re: “The partial correlation matrix described in the Examples Workbook […] is correct“…. When I open that workbook, there are #NAME errors instead of values because of the dependency on your Real Statistics add-in, which I had not downloaded.
I replaced all such dependencies with standard Excel 2010 functions: CORREL in H4:H7; and substituting the alternative formulas O11:O14 for the DIAG-dependent formulas in M11:M14. I also modified those formulas so they are not array-entered. “Keep it simple…”. But that exposed the numerical differences in H19:K22 and H27:K30, which had not been modified.
I should have been able to avoid the #NAME errors and see the values when you saved the Example Workbook by opening the workbook in Manual Calculation mode. We do that by starting Excel first, setting Manual Calculation mode, then opening the Examples Workbook in the same Excel instance. But that did not work because the #NAME errors are in the XML file (!). That is unusual.
Hi Ken,
I don’t know why the #NAME errors are in the XML file. In any case, the examples workbook was intended for someone who had already installed the Real Statistics add-in. No #NAME errors should result in this case.
Charles
Hello Charles!
I would love to know if the partial Regression coefficients are based on part correlations or partial correlations?
Hello Avshalom,
The partial regression coefficient described on this webpage is the same as the partial correlation coefficient described at
Multiple Correlation in the case where there are three variables.
E.g. if you look at the P, I, W variables on that webpage, we see from Example 2 that r_PI,W = .135. We get the same result if we use the formula =PCORREL(B4:D53,1,3).
Charles
hi sir, i need formula for correlate 5 variable….
This webpage describes how to calculate the correlation coefficient for any number of variables, including 5. This value can be obtained from the Multiple Linear Regression tool or the RSquare(R1,j) function, as described on this webpage.
Charles
I’m also having a bit of difficulty understanding this. should I just be able to use the function =MCORREL(L16,M16,N16) or =SQRT(RSquare(L16:N16, 3))
What does the out put look like? the correlation matrix? shown i figure 3?
I downloaded “Real-Statistics-Examples-Correlation-Reliability” workbook but didn’t see any examples of the formula being used.
Can you post a working example of the formula? I’m getting an error and don’t know what is wrong.
You can’t calculate the correlation based on a single triplet of data values such as L16, M16, N16. You need a triplet of data sets such as L1:L16, M1:M16, N1:N16.
In this case, the following should produce the same results (provided I didn’t make a mistake — try it out)
=MCORREL(N1:N16,L1:L16,M1:M16)
=SQRT(RSquare(L1:M16,N1:N16))
=SQRT(RSquare(L1:N16,3))
The result in each case is a single value and not a matrix.
Charles
=READ AGAIN
Hi Charles,
In case of using the function PCORR I always get a score of 1, without a matrix. Please note that I use Excel 2010. Where is the problem?
Thanks, Ozren
Hello Ozren,
PCORR is an array function and so you need to treat it a bit differently to get the rest of the matrix. See
Array Formulas and Functions
Charles
Dear Charles,
Thanks for the good content on your website! If I understand correctly, the theory of multiple correlation is used when one wants to find the correlation of a mix of multiple independent variables (e.g. q,x,y) to a specific dependent variable (e.g. z). Correct?
If so, then what approach can I use best if I want to do the following: I have a dataset of n rows and m columns (m can be bigger than 30). Each column is a specific machine setting. So each machine setting is an independent variable. The last column represents the machine speed, which is the dependent variable. Each row simply represent one observation (e.g. a 1 day production). Now I want to find ‘the combination of machine settings, i.e. combination of independent variables’ that has the highest correlation with the machine speed, i.e. the independent variable.
So I am not interested in the pairwise correlation coefficients but in the correlation of combinations of independent variables to the dependent variable. However, this just seems like simple multiple regression. So now I am confused what the difference is between multiple correlation and multiple regression?
Thanks in advance for your help!
Dear Michael,
1. What you stated in the first paragraph is correct.
2. Multiple correlation is related to multiple regression. In fact, the multiple correlation coefficient is the square root of R-square from regression. The highest such correlation occurs when all the independent variables are included. It is possible, however, to remove one or more of the independent variables and still get a correlation that is not significantly different from the correlation using all the independent variables.
Thank you for your wonderful work. Is it possible to run Two Stage Least Squares regressions in Real Statistics?
Hello David,
Real Statistics doesn’t currently support this capability, but I will eventually add it.
Charles
Hi Charles. Thanks for the brilliant solution to the excel limitation to get multiple correlation with a formula. I am trying to use RSquare function to get multiple correlation of stock index with its underlying symbols. There are 2 indices. First index has 27 underlying symbols and the second index has 52 underlying symbols. The function works for 8 symbols (X values columns) and index (Y value column). But it is not accepting more than 8 symbols and returning “1” as answer. Any suggestion on how to get the multiple correlation with a function for more than 8 X values Columns (27 and 52)? I am trying to get this with a function as I need to copy it down over multiple rows. Thanks again.
Hello Naresh,
The function will work with 27 or 52 variables, but the more variables, the more data rows you will need.
Charles
Hi Charles,
Thanks for the prompt response. Yes I could get it with number of rows equal to or greater than the number of columns. It was my stupid idea to find exact multiple correlation of underlying symbols with its index. It is always going to be 1 as the index is valued based on the market capitalisation of the underlying symbols at the current market price. 🙂
Hi Charles
Happy New Year!
If one is doing an exploratory multiple correlation analysis, how would you find the p values? I understand that you can use the excel function to do a multiple correlation, but excel does not show you the p values and I am not clear how on how to do this for multiple variables.
Thanks.
Hello Dennis,
You can use the linear regression data analysis tool to find both the multiple correlation and p-value.
Charles
Please illustrate or give an example on HOW to actually calculate Correlation Coefficient of multiple arrays, more than 2 using Ms Excels? Thank you.
Hello Luis,
Just use Excel’s Regression data analysis tool. See Figure 3 of
https://real-statistics.com/multiple-regression/multiple-regression-analysis/multiple-regression-analysis-excel/
Charles
Charles,
There is a typo in describing how to obtain the coefficient of determination using the jth diagonal element of the inverse correlation matrix. The formula should not have the squared root in it.
Thanks,
-Sun
Hi Sun,
Yes, you are correct. I have now corrected the webpage accordingly. As always, thank you very much for finding this error. I am very grateful to all your help.
Charles
Hi Charles,
To make my first question that I posted earlier, I am making it a bit finer. My question is: Can we use multiple correlation or multiple regression with four variables irrespective of being dependent or independent. These four variables contain further three categories from high to medium to lower. Thanks
Shabir,
Multiple regression is used to predict the value of a dependent variable. If there is no dependent variable, then there is no multiple regression.
Charles
Charles
I have been racking my brains trying to use your partial correlation matrix with the figures you give until I looked at the spreadsheet and realised that the matrix you show is probably from the full set and the figures you quote for the PCorrel are what comes from the partial set.
For the purposes of variable inclusion, I would find it easier if the results could be displayed as partial regression given y and independent variables included.
Great site –
Bryan,
I am pleased that you like the site and I appreciate your suggestion. I will look into how I can make the referenced webpage clearer.
Charles
Hello!!
I am working on a project which deals with the population (independent variable) and demand for housing loan (dependent variable) and housing loan disbursed (dependent variable). How can I correlate the housing loan disbursed amount with the housing demand and the population? looking forward for your reply
You need to have one dependent variable to use the approach described on the referenced webpage. It sounds like you should use the approach described in the referenced webpage, considering housing loan demand to be an independent variable.
Charles
Hi there I was wondering if you could explain more about how you got the figures in your inverse of correlation matrix as I’m struggling to understand it. I’m studying a level maths and I’m doing coursework on correlation. I have 3 sets of data and I’ve followed example 1 on this page and have made a correlation matrix but I’m struggling to understand how you got the figures for the inverse matrix and how you use that to get a correlation figure. I’m also not the best at excel so if you don’t mind could you explain the inverse matrix figures and the final correlation figure more simply for me.
I’d really appreciate any time given to help.
Conner,
For any n x n range R1, the Excel array formula =MINVERSE(R1) will return the inverse of the matrix in range R1. In the example the range R1 is the output from the Real Statistic array function CORR.
For the example, the data is contained in range B4:E18 and so =CORR(B4:E18) returns the correlation matrix for the data. This is shown in range H4:K7.
To get the inverse of the correlation matrix, we placed the array formula =MINVERSE(H4:K7) in range H11:K14.
Note that since we are using array formulas we need to press Ctrl-Shft-Enter and not simply Enter to get the correct output.
Charles
Thanks for the quick reply i have more questions though if you don’t mind.
Firstly is CORR the same as CORREL?
Secondly i have tried doing as you say by holding CTRL-SHIFT-ENTER but it only gives me a single number and i was wondering is this because i have done my correlation matrix manually rather than using the formula (which i did as i couldn’t understand still).
Also on a separate note and i know this is asking a lot but would it be possible for you to do a video of you doing example 1 so i can better follow your steps.
thanks again and for any time given to help.
Hi Conner,
CORR is not the same as CORREL. CORREL(R1,R2) returns one correlation coefficient for the data in ranges R1 and R2. CORR(R1) creates a matrix of correlation coefficients; if R1 has n columns, then the output from CORR is an n x n matrix containing the correlation coefficients for each pair of columns from range R1.
If the output from an array function is say a 3 x 5 range, you need to first highlight a 3 x 5 range, enter the formula containing the function and then press CTRL-SHIFT-ENTER. If you only highlight one cell, then the output you get will only be the upper-left cell from the 3 x 5 range. See the following webpage for details:
Array functions and formulas
I will eventually create videos of various topics, but for now I am focused on adding more content to the website. Next topic> time series analysis. This will appear in a few days.
Charles
Hi Charles
I have two data sets of same variables (example time and depth) like time1= 0.2, 0.4, 0.6, 0.7…and depth1 = 2300, 2600,2519, ….. and time2 = 0, 0.1, 0.22, 0.34, 0.5 ….. and depth2 =2100,2400,2500, 2700 …….. Now I want to calculate how much percentage is increase or decrease from first dataset to second dataset and what is the relation so that I can apply the other datasets.
N.B. :I am assuming that my first data set is correct
Thanks in advance
Sorry, but I don’t completely understand the scenario.
Charles
Dear Sir
I have climate (temperature, rain fall) and plant growth data over time. how can I show that plant growth is correlated to the influence from both temp. and rain fall together, not each one separately.
You can calculate the correlation of plant growth (P) with temp (T) and rain fall (R) using the MCORREL function and compare this correlation with CORREL(P,T) and CORREL(P,R).
To determine whether this difference is significant you can use the approach described in Significance of extra variables in multiple regression.
Charles
Dear sir
Greetings,
I am doing research work on marine biology, and collected animal samples (both male and female) from three different coastal habitat such as rocky, muddy and sandy shores, also quantified nutrient content of these animals.
All of my reference articles they have applied Paired sample mean ‘t’ test and they have collected data in two places only, but in my case which statistical analysis is applicable, please kindly give me suggestion with any example and how to interpret that result.
Assuming that you want to determine whether there are significant differences between quantified nutrient content of males and females and between animals that live in the three habitats, you can use Two Factor Anova.
Charles
Hi Charles
There is a way to Rsquare work with LN ranges (i.e. =RSquare((LN(C4:E18),B4:B18)?
Thank you very much.
Benjamim
Benjamin,
I’m not sure that I understand your question. You can certainly calculate the formula =RSquare((LN(C4:E18),B4:B18), but how and why do you want to do this?
Charles
If some of my independent variables have high correlation >70%, would be a good idea to keep them in the regression model? If I keep all of them, how could I justify that and would the results be feasible?
Thank you very much.
Daniel
Daniel,
I would leave them in the model and see whether there is a significant difference if you take one (or more) of these independent variables out, as described in Significance of extra variables.
Charles
Another question Charles:
Is there a test that will tell me if there’s a lurking variable I have not considered in an experiment?
In practice: say I got a correlation coefficient of 0.6 for my multi-attribute prediction of production (from my previous comment). Is there any way to tell if that ‘unexplained’ 0.4 is due to just noise or lurking/missing variable?
I am thinking that if I looked at the residuals and they were random, I’d be tempted to attribute the low correlation coefficient to noise, and accept the results, but if I saw a structure, perhaps linear, in the residuals, this could be an indication of a lurking variable (whether it can be measured or not, it would still be useful insight).
What do you think?
Thanks again,
Matteo
Matteo,
I can’t think of such a test at this moment.
Charles
Thanks Charles. Would you take a linear structure in the residuals as at least a qualitative hint that there may be a missing variable?
Matteo,
Sorry for the delay in responding. I can see why you would view a linear structure in the residuals as indicating the potential for a missing variable, but I haven’t had time to consder it further. Sorry for such a limited response. I will think about this issue further when I revise the residuals portion of the website.
Charles
Hi Charles
I think just above your definition 2, where you write:
“Observation: As described above, we can calculate using any of the following formulas to get the value .103292”
you are missing a formula image after “we can calculate”?
Hi Matteo,
Yes, you are correct. I have just added the missing expression. Thanks for catching this omission.
Charles
Hi Charles, there’s another omission in here:
Definition 2: Suppose that __ and X are as described in Definition 1
Matteo
Matteo,
Thanks for catching this. I have corrected the webpage adding the symbols that were inadvertently deleted. I appreciate your flagging the problem since it will make it easier for other readers to understand what is being said.
Charles
Hi Charles
You write below figure 1:”..The correlation matrix (range H4:K7) can be calculated as described in Multiple Regression Least Squares”. I can follow that post to a point, and created the covariance matrix (using my data), but do not see the example of how to create the correlation matrix (although I can create the pairwise correlation using the default tool in Excel). Am I missing something?
Thanks, Matteo
Matteo,
Perhaps this is what you are missing:
Let R1 be a k × n range which contains only numeric value, let R2 be a 1 × n range containing the means of the columns in R1 and let R3 be a 1 × n range containing the standard deviations of the columns in R1. Then you can use the following array formulas:
COV(R1) = MMULT(TRANSPOSE(R1-R2),R1-R2)/(ROWS(R1)–1) covariance matrix of R1
CORR(R1) = MMULT(TRANSPOSE((R1-R2)/R3),(R1-R2)/R3)/(ROWS(R1)–1) correlation matrix of R1
Let me know if this helps or confuses things more.
Charles
Hi Charles
Thanks for gathering the formulas next to one another and for generalizing the example. All clear. Formulas work like a charm.
Hi again
For my data, the coefficients in the correlation matrix calculated in your formula are the same as the pairwise correlation coefficients calculated using Excel’s correlation data analysis tool.
But if I compare yours they are different. For example, in this post, the correlation between Doctors and Crime is -0.117804, but in Figure 2 in here
http://www.real-statistics.com/correlation/multiple-correlation
the pairwise coefficient between Doctors and Crime is -0.09431. Can you explain the discrepancy?
Matteo,
The difference between the calculations on my website is that the data sets are different. In the case where the correlation is -0.117804 only the data for the first 15 states are being used. In the case where the correlation is -.09431 the data for all 50 states are being used.
Charles
Thanks for the clarification Charles.