The approach used in ANOVA using Regression and Unbalanced Factorial ANOVA can be extended to more than two factors. On this webpage, we show how to use perform three-factor ANOVA via regression using the Three Factor ANOVA Real Statistics data analysis tool.
Example 1: Perform the analysis for Example 1 of ANOVA with more than Two Factors using regression.
The input data from Example 1 of ANOVA with more than Two Factors is repeated in range AT3:BH11 of Figure 1.
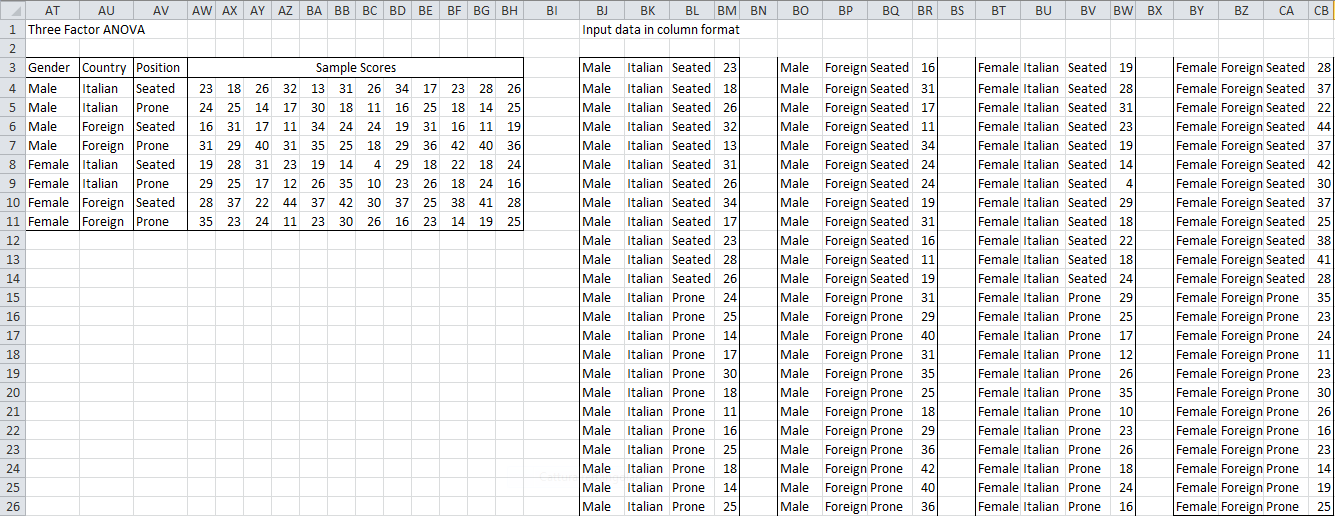
Figure 1 – Three Factor ANOVA using regression
To perform the analysis, click on cell BJ1 (where the output will start), enter Ctrl-m and select the Three Factor ANOVA option from the menu that appears. The dialog box in Figure 2 will now appear.
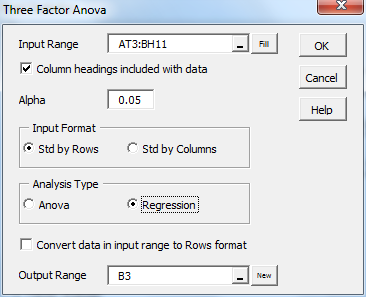
Figure 2 – Dialog box for Three Factor Anova
Enter AT3:BH11 in the Input Range, click on Column headings included with data, select Std by Rows as the Input Format, select Regression as the Analysis Type and click on the OK button.
The input data is first converted to standard format by columns as shown on the right side of Figure 1 (reformatted to fit more easily in the figure). From this reformatted data the regression model is created by the Real Statistics software as described in ANOVA using Regression. The following dummy variables are employed:
t1 = 1 if Gender = Male and t1 = -1 if Gender = Female
t2 = 1 if Country = Italian and t2 = -1 if Country = Foreign
t3 = 1 if Position = Seated and t3 = -1 if Position = Prone
The variables in the model are then t1, t2, t3, t1*t2, t1*t3, t2*t3, t1*t2*t3 and y, where y represents the scores.
All this is done automatically by the software and is not displayed. The results are descriptive statistics and ANOVA analysis, which are exactly as displayed in Figure 3 of ANOVA with more than Two Factors.
Observation: If the input data had been in column format then the analysis would have proceeded exactly as described above except that no data conversion would have been necessary.
Example 2: Repeat the analysis in Example 1 with the data in Figure 3 (unbalanced model).
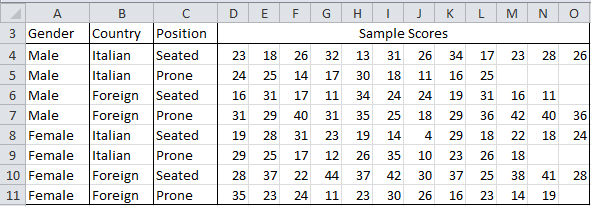
Figure 3 – Unbalanced Three-Factor ANOVA
To perform the analysis you repeat the steps used for Example 1. The output is displayed in Figure 4 (only the first 29 terms out of 89 in the conversion to column format are shown).
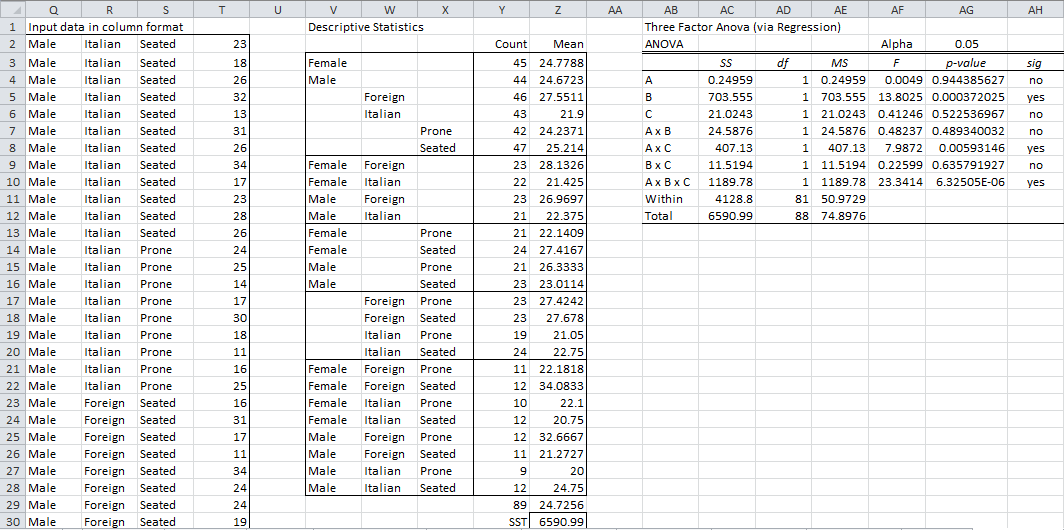
Figure 4 – Unbalanced Three-Factor ANOVA
Real Statistics Function: The following array supplemental function is contained in the Real Statistics Resource Pack:
SSAnova3(R1) – returns a column array with SSA, SSB, SSC, SSAB, SSAC, SSBC, SSABC and SSW for a three-factor ANOVA for the data in R1 using a regression model where the data in R1 is assumed to be in standard format by columns without column headings
Observation: The approach described in this section requires that all the interactions have at least one element in common. E.g. if one of the rows in Figure 3 contains no data, then the output from the analysis will be in error.
Observation: When the Regression option of the Three Factor ANOVA data analysis tool is chosen you are limited to 64 independent variables (i.e. the same limitation as the Linear Regression data analysis tool, as described in Multiple Regression Analysis). This means that if a = the number of levels for factor A, b = the number of levels for factor B and c = the number of levels for factor C, then abc can be at most 64.
Hi, Charles
What’s the formula to calculate ” AC4″in your Figure 4? I can’t understand that calculation procedures.
Bo,
The range AC5:AC12 is calculated using the Real Statistics array formula =SSAnova3(Q3:T91). Thus AC4 is just one of the outputs from this formula. The formula calculates the SS values for the various factors using regression. Regression is required since we have an unbalanced model. The value in AC4 is approximately =DEVSQ(Z4:Z5)*Y4, (the value if the model had been balanced), but not quite. The procedure used by SSAnova3 is described in detail at
https://real-statistics.com/multiple-regression/unbalanced-factorial-anova/
Charles
Mr. Zaiontz
It is really helpfull to me. But I have problem to show three factor ANOVA dialog box, I don’t know how to press Ctrl-m in excel to show the menu so I can choose three factor ANOVA. Is it the same way to press Ctrl+m?
Thank You
Syimah
Syimah,
Hold the Control key down and press the m key.
Charles
Hi Mr. Zaiontz
I’ve tried to press the way you showed me, but it didn’t work. Maybe there is some problem with my excel. Thank you for answering.
Syimah
Hi Charles,
I’m rather new to statistics, but have conducted a three factor ANOVA (age [months], replicates, and beer flavor attributes). The ANOVA calculation worked well, and both age and attributes were significant. It’s not a surprise to me that the attributes were significantly different (i.e. I know there is more citrus than honey flavor in the beer); what I really wanted to know is if/how the attributes changed over time.
I believe I’m correct in saying that the attributes do change over time (yes?), since age is significant, but from here I’d like to know which specific attributes are changing. When I’ve done two-way ANOVA in XLStat, it provides an option for pairwise comparisons to be included automatically – do you have a feature like that for the three-way ANOVA? If not, is my only option to determine which attributes change over time to either run a two-way ANOVA for each attribute individually (factors being time and replicates), and see which are different, or manually run a pairwise comparison between ages for each attribute?
I was hoping to fine a solution that required as little individual data analysis as possible, since I have 14 different attributes, and doing individual comparisons would take quite a while.
Sorry this was so long-winded! I appreciate this website and all your help!
Ali
Ali,
Yes, it is important to be able to perform follow-up testing. I have written a routine for doing this, but have not yet released it. I hope to do so either in the next release or the release that follows.
Charles
Hi Charles,
I know it’s only been a couple days since you responded to Ali, but do you have a timeline for release date? I, too, am in a similar predicament. Suffice to say, thank you so much for putting a package like this together.
Best,
Jabir
Jabir,
I now expect to provide this capability in the next release of the Real Statistics software. It should be available by the end of August.
Charles
Hi,
I performed the three-way ANOVA as described here. For one of the factors, I got a p-value of zero (not rounded off, even in scientific notation it is zero). Could you explain what happened there?
H.K.
If you send me an Excel file with your data and analysis, I will try to figure out why one of the p-values is zero.
Charles
Thank you very much for your helpful website, Mr. Zaiontz!!
I would like to do a three-way ANOVA using regression with one within subjects factor (repeated measure) and two between subjects factors. Is this possible using Excel and your RealStatistic-Tools? I am not sure how to combine “three-way ANOVA using regression” and “ANOVA with repeated measures (one within subjects factor and one between subject factors)”. If it is not possible using Excel and RealStatistic-Tools, is this possible using SPSS or BioStat?
Cheers, Jörg
Jorg,
I don’t yet support 3-way ANOVA with repeated measures. I am not sure about support from SPSS or Biostats.
Charles
Hi Charles.
Thank you for providing your real stats add-in. It is amazing and I really like it.
I just have a question to check. Can I do a single replicate ANOVA analysis of 3 factors and above? It seems to generate error using this three factor ANOVA option.
If I were to do it myself, is it the same as just summing the sum of squares of the higher order interaction and counting it as SS_error and DOF_error?
Thank you so much! I am in urgent need to clarify this.
Hi Wee Hong Jie,
As you have noted, the analysis for three factor ANOVA is not correct if there is no replication.
If there is no replication, you need to calculate MS, SS and df values for factors A, B, C, Error and Total. The values for factors A, B, C and Total are calculated exactly as in the case with replication. SSE = SSTot – SSA – SSB – SSC and dfE = dfTot – dfA – dfB – dfB and MSE = SSE/dfE. The F value for factor A is MSA/MSE, and similarly for factors B and C. The p-value for factor A is =FDIST(f,dfA,dfE) or =1-F.DIST(f,dfA,dfE,TRUE) where f is the F value for factor A. The p-values for B and C are similar.
Charles
How do i get in touch with you?
See Contact Us.
Charles
Dear Charles,
Thanks for putting the analysis package using Excel available for the research community.
In the two or three factor ANOVA, there are two options in the “Analysis Type” panel: either “ANOVA” or “Regression”. I found that the analyzed results are significantly different when choosing “ANOVA” from “Regression”.
My question is when should I choose “ANOVA” to analyze the data and when I should choose “Regression” to analyze the data? What is the difference when the different Analysis Type is selected?
Thank you for your answer in advance.
With kind regards
Ben Huang
Ben,
For a balanced model, the results should be the same, although the ANOVA calculations are simplier. For an unbalanced model you should use the regression version.
If you have a balanced model (for each factor the size of all groups for that factor are the same), then I would appreciate your sending me an Excel file with your data so that I can try to figure out why the results are not the same.
Charles
Dear Charles,..
nice example that you explain about more than 2 factor for ANOVA analysis (3 factor in example).
Is it same way to analyze for 4 factor and each factor have 3 level?
Thanks
Rifel
Rifel,
Yes, the four factor model is constructed pretty much as for the three factor model. Caution: it is hard enough to interpret a three factor model properly; the four factor model is that much more difficult.
Charles
Dr Zaiontz
I have tried an unbalanced three-way ANOVA as described above but it is coming up with an error stating it needs equal sample sizes. I will send you the spreadsheet to see where the problem is. I don’t think the number of factors is the problem as it is 3 (treatment effects) x 5 (time points) x 2 (gender) = 30.
Regards
Sean
Sean,
This bug should be fixed in Release 3.2, which is now available. Please let me know if this resolves the problem.
Charles
Hi Charles
Thank you for your quick response. I tried the Realstats-2011-Oct-2014 as suggested and the unbalanced 3-way ANOVA still comes up with the following error “Input in standard form cannot contain any empty cells.”
Regards
Sean
Sean,
Was the data formatted in standard format by rows or by columns? If you send me a spreadsheet with the data I will try to figure out where the problem is.
Charles
Sean,
I understand the problem now. The Mac release still has an error. I have fixed the error in the releases for Excel 2007/2010/2013, but not Excel 2011. I need to wait until I get hold of a Mac to make the correction. Sorry about that.
Charles
Hey Charles,
I am having the same problem as the previous respondents with the #VALUES showing up. I am sending you the spreadsheet.
Cheers,
Katie
Katie,
Thanks for sending me your spreadsheet. I have two observations:
1) One of your data elements is missing (cell D47). You need to supply a value for this entry or remove it from the list. Once you do this the #VALUE! error will disappear.
2) Once you do this, it appears that the only significant factor is the once corresponding to column B (p-value close to 0). I reran the ANOVA model with just this factor (using One-Factor Anova in standard format) and found that once again p-value was close to 0.
Charles
Hi Charles
I have a similar error as the gentleman above. When the SSAnova3(R1) function is performed, it returns an error “#VALUE! in the ANOVA results table. I will send you the spreadsheet.
Regards,
Allan
Allan,
I look forward to receiving your spreadsheet.
Charles
Hi Allan,
The Real Statistics Resource Pack uses Excel’s LINEST function in calculating the regression model. This function is limited to 64 independent variables. The number of independent variables for your 3 factor ANOVA model is 2 x 2 x 24 = 96, which is larger than the limit.
In the future I will try to increase this limit.
Charles
Charles,
I have a set of data which is well above the 64 limit. Is there an update that overcomes this or another add-in you can recommend for me?
Thanks,
Russ
Russ,
Sorry Ross, but the Real Statistics Resource Pack is limited to 64 variables. I don’t know of another add-in with a higher limit, but there probably are some. I will add this to the list of enhancements.
Charles
Hi,
I followed your instructions regarding the three factor ANOVA using regression in an attempt to run an ANOVA with unequal n values. However, the ANOVA table generated as a result of this has errors for the values for some reason.
http://i.imgur.com/OxCn93B.png This is a screen shot of what I’m talking about.
Any help would be greatly appreciated.
Peter
Peter,
It is hard to figure out what went wrong by looking at the screenshot. Can you send me an Excel worksheet with the data so that I can take a look at it?
Charles