Omnibus Test
The Kruskal-Wallis H test is a non-parametric test that is used in place of a one-way ANOVA. Essentially it is an extension of the Wilcoxon Rank-Sum test to more than two independent samples.
Although, as explained in Assumptions for ANOVA, one-way ANOVA is usually quite robust, there are many situations where the assumptions are sufficiently violated and so the Kruskal-Wallis test becomes quite useful: in particular, when:
- Group samples strongly deviate from normal; this is especially relevant when sample sizes are small and unequal and data are not symmetric.
- Group variances are quite different because of the presence of outliers
If the assumptions of ANOVA are satisfied, then the Kruskal-Wallis test is less powerful than ANOVA, and so you should use ANOVA. This is also the case when a transformation can be used to meet the ANOVA assumptions. When the homogeneity assumption fails, Welch’s ANOVA is often preferred over the Kruskal-Wallis test.
Assumptions and Characteristics
Some characteristics of Kruskal-Wallis test are:
- The assumptions are similar to those for the Mann-Whitney test: independent group samples, data in each group is randomly selected and data is at least ordinal
- No assumptions are made about the type of underlying distribution, although see below
- Each group sample has at least 5 elements.
- Note that no population parameters are estimated, and so there are no confidence intervals.
Interpretation
The Kruskal-Wallis test is actually testing the null hypothesis that the populations from which the group samples are selected are equal in the sense that none of the group populations is dominant over any of the others. A group is dominant over the others if when one element is drawn at random from each of the group populations, it is more likely that the largest element is in that group.
H0: the group populations have equal dominance; i.e. when one element is drawn at random from each group population, the largest (or smallest, or second smallest, etc.) element is equally likely to come from any one of the group populations
H1: At least one of the group populations is dominant over the others
When the group samples have the same shape (and so presumably this is reflective of the corresponding population distributions), then the null hypothesis can be viewed as a statement about the group medians.
H0: the group population medians are equal
H1: the group population medians are not equal
An indication that the population distributions have the same shape (except that possibly there is a shift to the right or left among them) is that the box plots are similar, except that the box and whiskers among them may be at different heights. Another indication is that the group histograms or QQ plots look similar (although not necessarily indicating normality).
Test Statistic
Property 1: Define the test statistic
![]()
where k = the number of groups, nj is the size of the jth group, Rj is the rank sum for the jth group, and n is the total sample size, i.e.
![]()
Then
![]()
provided nj ≥ 5 based on the following null hypothesis:
H0: The distribution of scores is equal across all groups
Observations
If the assumptions of ANOVA are satisfied, then the Kruskal-Wallis test is less powerful than ANOVA.
An alternative expression for H is given by
![]()
where 
}")
If there are small sample sizes and many ties, a corrected Kruskal-Wallis test statistic H’ = H/T gives better results where
![]()
Here the sum is taken over all scores where ties exist and f is the number of ties at that level.
Example
Example 1: A cosmetic company created a small trial of a new cream for treating skin blemishes. It measured the effectiveness of the new cream compared to the leading cream on the market and a placebo. Thirty people were put into three groups of 10 at random, although just before the trial began 2 people from the control group and 1 person from the test group for the existing cream dropped out. The left side of Figure 1 shows the number of blemishes removed from each person during the trial.

Figure 1 – Blemish treatment data
Testing Assumptions
Based on the Shapiro-Wilk test, shown on the right side of the figure, we see that two of the groups are not normally distributed. This conclusion is confirmed by the QQ plots (not shown here). We, therefore, decide to use the Kruskal-Wallis test instead of ANOVA.
From the box plots shown in Figure 2, we observe, that although the group distributions don’t have the exact same shape (consistent with the fact that two are not normally distributed, while one is normally distributed), their shapes are fairly similar (although the values for the New group are larger than for the other two groups). Thus, we can use Kruskal-Wallis to test the null hypothesis that none of the groups is dominant over the others, and perhaps even that the group medians are equal.
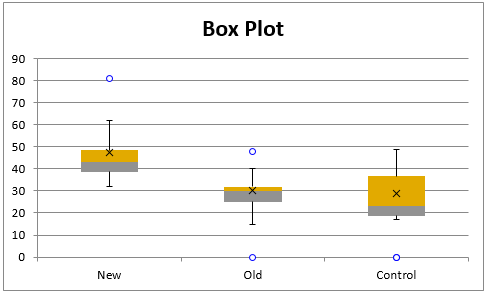
Figure 2 – Box plot comparisons
Test
We now carry out the Kruskal-Wallis test as shown in Figure 3. Using the RANK.AVG function (or the RANK_AVG function for Excel 2007 users), we obtain the ranks of each of the raw scores, as shown in range G4:I13. E.g. cell I4 contains =IF(ISNUMBER(D4), RANK.AVG(D4,$B$4:$D$13,1),””).
We next calculate the sum of the ranks for each group, namely R1 = 199, R2 = 96.5 and R3 = 82.5. Next, we square each of these values and divide by the number of elements in the corresponding group to obtain the figures shown in range G16:I16. The remaining formulas in the figure are shown in column L (corresponding to formulas in column J).
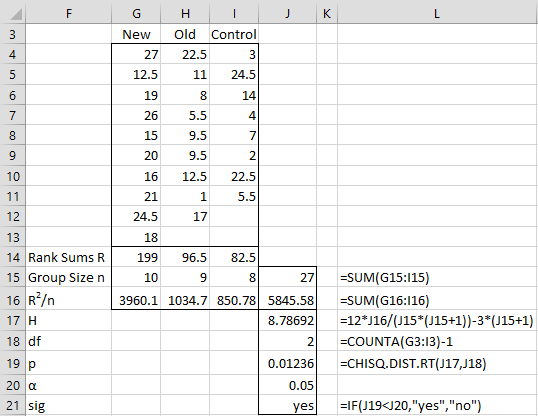
Figure 3 – Kruskal-Wallis test
Since p-value = .01236 < .05 = α, we reject the null hypothesis and conclude there is a significant difference between the three cosmetics.
Note that we can perform a one-way ANOVA on the ranks (i.e. the data in range G3:I13) using Excel’s ANOVA: One Factor data analysis tool (or the Real Statistic data analysis tool) to find SSB. This provides an alternative way of calculating H (see Figure 4) since H is equal to
![]()

Figure 4 – ANOVA on ranked data
Worksheet Functions
Real Statistics Functions: The Real Statistics Resource Pack contains the following functions:
KRUSKAL(R1, ties) = value of H on the data (without headings) contained in range R1 (organized by columns).
KTEST(R1, ties) = p-value of the Kruskal-Wallis test on the data (without headings) contained in range R1 (organized by columns).
When ties = TRUE (default) then a ties correction is applied.
For Example 1, KRUSKAL(B5:D14) = 8.7869 and KTEST(B5:D14) = .01236.
The resource pack also provides the following array function:
KW_TEST(R1, lab, ties) = the 4 × 1 range consisting of the values for H, H′, df, p-value. If lab = TRUE then an extra column is added containing labels. If ties = TRUE (default) then H’ is used to calculate the p-value; otherwise, H is used to calculate the p-value.
Data Analysis Tool
Real Statistics Data Analysis Tool: The Real Statistics Resource Pack provides a data analysis tool to perform the Kruskal-Wallis test.
To use the tool for Example 1, press Ctrl-m and double-click on Analysis of Variance (or click on the Anova tab if using the Multipage interface) and select Single Factor Anova. When a dialog box similar to that shown in Figure 1 of ANOVA Analysis Tool appears, enter B3:D13 in the Input Range, check Column headings included with data, select the Kruskal-Wallis option, and click on OK.
The output is shown in Figure 5.

Figure 5 – Kruskal-Wallis data analysis
The H′ value (including a ties correction) can be calculated by =KRUSKAL(B4:D13) and the corresponding p-value by =KTEST(B4:D13). In fact, the range Z12:Z15 can be calculated by =KW_TEST(B4:D13).
Follow-up Tests
If the Kruskal-Wallis Test shows a significant difference between the groups, then pairwise comparisons or contrasts can be used to pinpoint the difference(s) as described following a single factor ANOVA. It is important to reduce familywise Type I error.
For more information about these follow-up tests and how to perform them in Excel, click on any of the following links:
- Nemenyi Test
- Dunn’s Test
- Schaich-Hamerle Test
- Conover Test
- Steel Test
- Pairwise Mann-Whitney tests
- Contrasts
References
NCSS (2012) One-way analysis of variance
https://www.ncss.com/wp-content/themes/ncss/pdf/Procedures/NCSS/One-Way_Analysis_of_Variance.pdf
Hollander, M., Wolfe, D. A. (1999) Nonparametric statistical methods, 2nd ed. Wiley
Lomuscio, S. (2021) Getting started with the Kruskal-Wallis test
http://library.virginia.edu/data/articles/getting-started-with-the-kruskal-wallis-test
Dear Charles,
we have a complicated dataset and are unsure about the statistics. Lets say we counted cells in different layers in all areas of the brain. Then we computed a ratio of cell numbers. The ratio is defined as (L5 + L6)/(L2 + L5 + L6). To find out if L5 or L6 are predominantly determining the ratio we first excluded L5: new formula for the ratio: L6/(L2 + L6) and secondly excluded L6: new formula for the ratio: L5/(L2 + L5). As a result we have 3 groups that we want to compare. The groups are somewhat connected but not paired in a sense that they were repeated measures. What is your suggestion for statistics or should we rethink our math?
Dear Jürgen,
Sorry but I didn’t understand the scenario that you described.
What does the sample consist of? Different areas of one brain? Several brains?
Charles
Dear Charles,
the sample consists of labeled cells in a total of six mouse brains. We count the labeled cells and assign them to different layers of all brain regions. Then we calculate the index described above, which is supposed to be a hirarchical dominance index. L5 and L6 stands for layer 5 and layer 6 of the mouse cortex. I hope this helps to understand my description above. The aim is now to find out whether layer 5 or layer 6 primarily determines the hierarchical index. That’s why we first deleted one layer and then the other from the formula. Is that mathematically correct?
Jürgen
Juergen,
Does this mean that you have a sample of 6 mouse brains and for each brain you have 3 measurements: (a) L5 and L6 included, (b) L5 excluded, and (c) L6 excluded ?
Charles
Yes. Does this make sense or should we only compare L5 excluded, and L6 excluded?
Jürgen
This depends on what hypothesis you want to test.
Charles
This is written in my initial comment from April 4th. “To find out if L5 or L6 are predominantly determining the ratio, which is defined as (L5 + L6)/(L2 + L5 + L6)”.
Sorry, Jurgen, but I don’t know the answer to your question.
Charles
thank you for your honesty. I guess we need to rethink our calculation. Best, Jürgen
Hi Charles,
Brilliant explanation!! I have just got a quick question – I have conducted my normalization test for ANOVA from which it was not accepted. My next step is to use Kruskal wallis, however I am wondering whether this would work if my dependent variable is presented as percentage (the only output of the software that I am using)? OR do I need to adopt some sort of transformation in order to conduct Kruskal wallis? I think that this was one of the reasons that my data did not adhere to the normality assumption. For example, I want to see if there is a statistical significant difference in percentage of words related to happiness between different ethnicities. Some percent values are 0%.
Thank you in advance for looking into this.
Poppy,
I don’t know of any restrictions to the Kruskal-Wallis test that would prevent you from using it with data in the form of a percentage.
A bigger issue is whether the homogeneity of variance assumption holds.
Charles
Hello Charles! Thank you for this! It was very informational, especially for me, as a beginner in statistics. I also hope you can answer my questions regarding a dilemma I am facing in my data analysis. In our study, the sample population was comprised of volunteers, which was initially assigned randomly to a group category, among 4 groups; wherein, they will take the same test but with different test conditions. The data gathered showed homogeneity in its variance, per the Levene’s test, and each data set from each group were assumed to be normally distributed, per the Shapiro-Wilk test. Overall it satisfies two assumptions for ANOVA, implying that Kruskal-Wallis is less powerful, and ANOVA is recommended, however, the sampling method was not random, so what statistical tool should we use?
It really depends on how the data was sampled. If it wasn’t too far from random, perhaps ANOVA would be ok. BTW, why did you perform Kruskal-Wallis since KW also requires random samples?
Charles
We haven’t used Kruskal-Wallis yet, we were still deciding on what would be the appropriate statistical tool to be used, but we initially considered KW. Then, after seeing this, we considered doing the tests for the assumptions of ANOVA, to see if ANOVA would be feasible. Based on your response to my colleague and the satisfaction of the assumptions for ANOVA, we now think that ANOVA would be the logical option, considering that the initial random assignment negated any confounding variables. Anyways, we express our utmost gratitude to you for helping us in our dilemma!
Hello Sir Charles! Thank you for this, it was very informational, especially to me, as a beginner in statistics. I also have few questions, in our study the sample population was gathered using voluntary response sampling, as it was the most convenient and feasible option. Then, the participants were initially assigned randomly to a group, within four groups to take the same tests but with varying test conditions. The data collected was assumed to be normally distributed, as the data sets in each of the four groups were assumed to be normally distributed, per the Shapiro-Wilk Test. The data also showed homogeneity in the variance, per Levene’s test. So I’m confused on whether Kruskal-Wallis or ANOVA should be used, especially it was mentioned that when the assumptions of ANOVA are satisfied, Kruskal-Wallis is less powerful and ANOVA is recommended instead. However, as far as I’ve read, another assumption of ANOVA, is the randomness of the sample selection, so what would the recommended statistical tool be? I am really confused as a beginner. I would like to thank you in advance for your help!
I just responded to you or a colleague of yours about this issue, but I can now add the following. Since you assigned the participants randomly to the groups, you might be ok with using ANOVA. You are hoping that any confounding factors are washed out by the random assignment of participants to the individual groups, especially if the sample sizes are not too small.
You should use ANOVA instead of KW.
Charles
Hi Charles,
Please can you help me with a proof for the kruskal Wallis formula.
Hi Stecy,
You can look at the 1952 paper by Kruskal and Wallis. See
https://www.jstor.org/stable/2280779?seq=1
Charles
I have a simple data table describing the percentage of area burnt as mapped from satellite for 20 years. This is separated into various land types. In 2013 the fire management changed in some but not all areas. I want to compare the percentage area burnt for 2000 to 2012 with 2013 to 2019, in those areas that changed their fire management, alone and against those that did not. I did a simple 2-tailed T-test with unequal variance and it provides a p value, however others are saying I should check or correct for normality and use a non-parametric test if need be. Do you have an opinion?
Andrew,
The t-test requires that the two samples come from normally distributed populations. You should check to see whether the two samples are normally distributed. If not, you should consider using the Mann-Whitney, non-parametric test.
CHarles
Hello,
In my study, I have asked participants to evaluate language users on a variety of traits by using a 6 point Likert scale. I have divided the participants by gender and I’d like to test if there are any significant differences among the opinions of men and women. I have calculated all the values up until df, but when it comes to the p value, an error appears and I can’t calculate it. I was wondering if I could get some help. Thank you in advance!
Evgenia,
I don’t understand what you mean by “I have calculated all the values up until df”. Also, are you performing a separate Kruskal-Wallis for each trait? Why not use a Mann-Whitney test if you only have two groups, mean and women?
Charles
Hello,
If I have a set of data like this:
type value
1 10
1 9
1 8
2 9
2 9
2 6
3 4
3 10
3 5
Can I use Kruskal wallis ? or do you have other methods which is more suitable?
Thank you
See my previous response.
If your total sample size is 9, it may not matter since your sample is so small.
Charles
So, what is the limitation of sample that we should consider using Kruskal wallis?
Thank you
Hello Charles, I have this data set below, my project is to study the effect of material type and bridge structure on ultimate bridge compressive strength i.e. to determine which type of material and bridge structure results in the greatest ultimate compressive strength in a static stress/stress analysis simulation experiment
Material Beam Arch Truss
Wood 0.021129 0.0754684 0.0578644
Concrete 0.025355 0.0804373 0.0663082
Iron 0.041004 0.0805563 0.0686463
Steel 0.04331899 0.0834081 0.0702971
Aluminium 0.04661837 0.101708 0.0744484
Copper 0.0520137 0.111316 0.0754676
Which test am i to use, above is the table. I tried tow factor ANOVA it doesn’t meet the assumptions of symmetry and homodaescity, I’m now stranded what do i do. Should I use the Kruskal Wallis of the Friedman’s test. Thank you for your assistance
1. How does the data relate to compressive strength? Are these three different measures of compressive strength for each material or is there one overall measure from combining the three measures?
2. None of the typical statistical tests yield the greatest compressive strength. They would determine which are significantly different and so in that way you could determine that one is significantly greater.
Charles
Thanks for your response. Please, I sent you an email Sir explaining all the details
But summary and response to your questions in brief
1. The data is in row and column format for example the first value under column Beam and row Wood is the compressive strength of a Beam Bridge made of Wood and so on hence these are three different measures of compressive strength for each material for Beam, Arch and Truss respectively.
2. Okay that way I would like to see which are significantly different so as to determine which one is significantly greater
I used two way anova but the results don’t meet the assumptions of normality and homodaescity so I want to know which test I can use for that dataset or will two way anova still work?
Sir can I have the current email address you are usong maybe the one I sent to is not functional. Please I need your help. Thank you
See Contact Us
Charles
Hello,
I have sent you an email with further information.
Charles
Good Evening,
I am conducting analysis on survey data in which my hypotheses are based on membership. My research hypothesis is based on the different types of credentials members report and attitudes toward various eligibility criteria. I am attempting to conduct a Kruskal Wallis due to the levels on the independent variable and the ordinal data on the dependent variable but I am getting errors. Have I made the wrong statistical analysis?
Anna,
I don’t have enough information to say whether you are using the wrong test. What sort of errors are you getting?
Charles
Hello Charles,
I have three groups for comparison. One of the group had 4 elements (rows). The remaining two groups have 5 and 6 elements. Is it incorrect to use Kruskal Wallis?
Sujatha,
You should be able to use the KW test even with one group having 4 elements, but with such a small sample, the power of the test (i.e. the ability to detect an effect) will be quite poor.
Charles
Thanks Charles for you inputs. Could you please suggest whether the following helps or not?
I understand for statistically powerful results lower values of n do not work all that very well.
This is an educational research on collaborative lab-work with each element having n=3, meaning each group has a sample size of 12, 15, 18 respectively. And, I also have three such study suggesting the same interpretation.
I also plan to substantiate it with the qualitative remarks wherever significant differences are emerging.
Both the quantitative and qualitative differences are supporting our hypothesis.
Would it work or do you think I may still be leaving out ambiguity with my claims?
Kindly suggest.
Charles, really thanks for supporting. I am glad that I am able to seek expert help on this.
Sujatha,
Samples of size 12, 15 and 18 are probably ok for getting reasonable power (depending on the size of the effect being tested).
Charles
Charles,
I have got stuck at one point.
In one of the comparisons, the Kruskal Wallis result indicates significant difference with small effect size but the post hoc Nemenyi is not showing where the difference is. In other words, all the groups are same as per Nemenyi.
Could you please suggest why is this happening?
Thanks for helping me and of course so many others with the software. Almost all of my analysis through your software as well as clarifying the doubts during analysis.
Sujatha,
Ideally, this should not happen, but since these are different tests it can happen.
If you send me an Excel file with your data and test results, I will try to discover why this has happened.
Charles
Good day Charles! I would like to ask what statistical test should have made for these data. I sampled the amount of microplastics in five rivers for both surface water and sediment, however it is only one-time sampling. Hence, the data I know have is like this:
Surface Water – Abundance [particles/L]
River A – 55,535
River B – 2,353
River C – 11,546
River D – 8, 673
River E – 1, 034
Sediment – Abundance [particles/kg]
River A – 1,055
River B – 653
River C – 342
River D – 1,035
River E – 689
I would like to know if there is a significant relationship in each river in their abundance. Or should I add other parameters? Looking forward to your response, will be a big help for me. Thank you very much!
Ezra,
Sorry, but I don’t understand what you mean by “significant relationship in each river in their abundance”. Please explain what hypothesis you are trying to test.
Charles
I have the list of percentages and I would like to find out whether there is a statistical difference between them, will Kruskal =-wallis test work for me?
67.49
51.49
54.91
59.02
63.69
66.56
65
61.76
66.31
59.46
59.52
60.39
87.48
70.85
61.95
60.64
80.32
65.44
51.24
49
John,
If I understand correctly, you have one data set with 20 elements. This doesn’t look a fit for Kruskal-Wallis which requires two or more groups. I have a pretty good idea about how you approach this problem, but first, let’s see whether you can figure it out with a little help from me. My question to you is what are the null and alternative hypotheses that you are trying to test?
Charles
Hello,
I am performing ANOVA and due to less number of samples, I have opted to use Kruskal Wallis Test.
I am performing ANOVA on construction site layout on which facilities are located at a different location inside the site boundary. hence distance travelled from facilities to the building is calculated. distance calculation is based on four personals executing the work for a given quantity.
In my layout, personals number and amount of work remains the same, only the position of facilities change which result in change distances travelled on the site.
Hence the median distance travelled shall also change for each site layout group
My question is will i be able to perform ANOVA using KW test and what should be post hoc test as per your recommendation
What hypothesis or hypotheses are you trying to test?
Charles
Hello Charles,
I’d like you to confirm that I have chosen the right statistical test for a problem.
We want to evaluate the effect of a workshop on the rate of sick leave among workers during the 2 following months.
We suppose that the workshop will decrease the rate of sick leave for the months March and April this year (after the workshop), compared with the same months during the 3 preceding years (as historical control with no workshop).
Is the Kruskall Wallis the right test to perform, given the small sample size ?
Thank you very much !
Have a nice day
Hello Louis,
Probably not since I believe that you are comparing the subjects at different time periods. I would need more information to be able to say what is the correct test.
Charles
Hi Charles, Thank you for your answer.
Please find here more details :
We have 2 departments, A and B, from an enterprise.
We introduced a workshop to educate workers about disease prevention measures. Approx. 90% of all personnel attended the workshop.
The workshop took place during one week (end of February) and we want to study its effect on the next 2 following months, March and April 2020, compared with the 2 preceding years.
We are interested in the ‘usual disease’ category of sick leave (not : work-related damage, long-term disease, maternity leave). The units are FTE (full-time equivalent).
Departement A :
‘Ordinary disease’ sick leaves rates
– for 2018, months 01, 02, 03, 04 : 25.08, 24.2, 27.68, 25.74
– for 2019, months 01, 02, 03, 04 : 26.26, 32.19, 33.75, 30.47
– for 2020, months 01, 02, 03, 04 : 21.14, 25,08, 27.18, 24,82
Department B :
‘Ordinary disease’ sick leaves rates
– for 2018, months 01, 02, 03, 04 : 22.60, 20.81, 21.93, 22.55
– for 2019, months 01, 02, 03, 04 : 23.10, 24.94, 24.49, 23,99
– for 2020, months 01, 02, 03, 04 : 21.03, 23.39, 31.98, 25.55
We assume that the personnel in those 2 departements are independant and do not do the same job. So we don’t want to compare one department to another. We’d rather compare the burden of sick leave in 2020 compared to 2018, 2019.
What do you think about it ?
Thanks
Louis
Please help me – what I am doing wrong? Following is my 4 groups of data. Since only n=9, I think we should use non-parametric test, I used Kruskal-Wallis followed by Dunn with Bonferreni. I see very clearly that Untreated values are significantly different and range from 181-218, whereas Treatment range from 9-13; and are clearly different. Yet, with Dunn test, it does not come out to be diffrenet with p-value = 0.069 > 0.05 > 0.00833 – not significantly diffeent. Can you please help me understand why??????
Untreated 181.9294456 199.4480442 195.6563475 189.8008159 192.8965683 205.9515239 190.8567315 200.8399328 218.7185025
Treatment-1 11.48655717 12.67915054 12.59545978 11.73762946 11.63301601 12.51176901 8.400460299 8.337692227 9.373365415
Treatment-2 5.251595355 5.826969348 5.680510514 6.266345852 6.737106392 6.778951773 2.092269066 2.406109426 2.53164557
Treatment-3 4.718066743 4.895909614 4.77037347 5.670049168 5.73281724 5.71189455 4.330996966 5.115597866 5.094675175
DUNN’s TEST alpha 0.05 0.008333333
group R-sum size R-mean z-crit
Untreated 288 9 32
100W 207 9 23
250W 94 9 10.44444444
1000W 77 9 8.555555556
36 1.959963985
D TEST
group 1 group 2 R-mean std err z-stat R-crit p-value
Untreated 100W 9 4.966554809 1.812121349 9.734268552 0.069967448
Untreated 250W 21.55555556 4.966554809 4.34014249 9.734268552 1.4239E-05
Untreated 1000W 23.44444444 4.966554809 4.720464255 9.734268552 2.35307E-06
100W 250W 12.55555556 4.966554809 2.528021141 9.734268552 0.011470744
100W 1000W 14.44444444 4.966554809 2.908342906 9.734268552 0.003633497
250W 1000W 1.888888889 4.966554809 0.380321765 9.734268552 0.703706581
Hello Anubhav Singh,
I agree that it is surprising that Untreated vs Treatment 1 doesn’t give a significant result.
In any case, even with n = 9 you should prefer to use ANOVA rather than Kruskal-Wallis. According to the d’Agostino-Pearson all 4 groups are normally distributed (although two are not normally distributed according to the Shapiro-Wilk test). Since all 4 groups are reasonably symmetric this favors ANOVA over KW. The problem with ANOVA, though, is that the homogeneity of variances assumption is strongly violated. The correct test is, therefore, Welch’s ANOVA followed by Games-Howell. Welch’s test is highly significant. All Games-Howell pairwise comparisons, with the exception of Treatment 2 vs Treatment 3, are highly significant. p-value = 1.92E-10 for Untreated vs Treatment 1.
Charles
Hello, good afternoon.
I have a questions regarding the SE for the Conover test. The initial equation should be like this =SQRT((AF$8*(AF$8+1))/12*(AF$8-1-KRUSKAL($B$4:$D$13)/(AF$8-COUNT(AF$5:AF$7)))*(1/AF5+1/AF7))
but you posted that the equation is =SQRT((AF$8*(AF$8+1)/(AF$8-1))/12*(AF$8-1-KRUSKAL($B$4:$D$13)/(AF$8-COUNT(AF$5:AF$7)))*(1/AF5+1/AF7))
I do not understand how or why an AF$8-1 was added to the initial part of such equation. Can you provide some light on it, please?
Hello Raul,
The problem is that there is an error in the program. Thank you very much for finding this error.
I will issue a new release of the software tomorrow to correct this bug. In addition, I will use an updated version of the test that is slightly better when ties are present.
Charles
Sorry for the delay, Raul. I have found another error that I am trying to correct before I issue the new release.
Charles
Raul,
The new release is now available.
Charles
Regarding the Follow-up tests, is there a need to adjust the alpha level based on the number of pairwise comparisons, e.g., Bonferroni??
Yes, you will need to adjust the alpha value, for example by using a Bonferroni correction. There are other choices as explained at
Kruskal-Wallis Follow Up
Charles
why we go to non parametric test
They have fewer assumptions.
Charles
Charles,
Is it possible to still calculate power, effect size, and sample size when using the Kruskal-Wallis test? When using Real Stats in Excel, I only see options for parametric tests to calculate power and sample size.
Thank you!
In general there are fewer measures of effect size for nonparmetric tests and calculating power and sample size is more difficult. There are probably some approaches for the Kruskal-Wallis test, but I am not familiar with these. I tend to use the measurements from the nearest parametric test, ANOVA in this case, but I am not really sure how accurate this is, probably not very accurate.
Charles