Another approach to handling ANOVA type analyses when the assumptions are violated is to use resampling, as described in Resampling Procedures.
Example 1: Repeat Example 1 of Kruskal-Wallis using bootstrapping (the data is repeated in Figure 1).
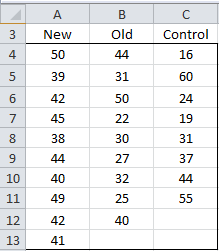
Figure 1 – Sample data
The sample data contains 27 data elements: 10 New, 9 Old and 8 Control. As can be seen in Kruskal-Wallis, the data violates the homogeneity of variance assumption, and so we can’t be sure whether ANOVA will yield valid results. We, therefore, use the Resampling data analysis tool as follows.
Press Ctrl-m and double-click on the Resampling data analysis tool from the menu. Next fill in the dialog box that appears as shown in Figure 2 and click on the OK button.
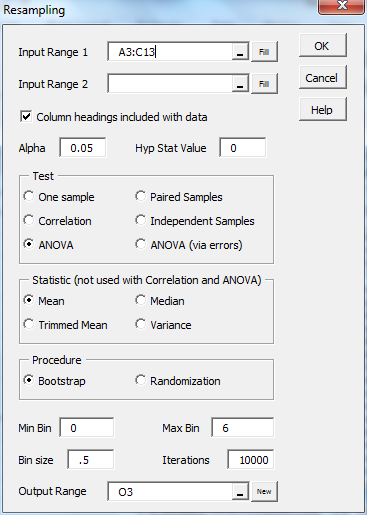
Figure 2 – Resampling dialog box
The output is shown in Figure 3.
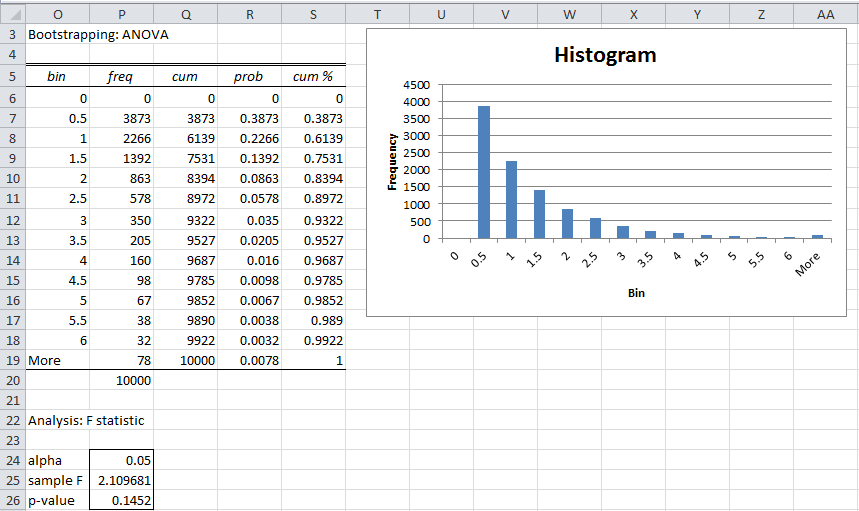
Figure 3 – Bootstrapping test for ANOVA
The data analysis tool first calculates the F-stat for the sample data. This can be done using the Excel or Real Statistics One-sample ANOVA data analysis tool or via the ANOVA1 function. For Example 1, F-stat = ANOVA1(A4:C13) = 2.109681.
The data analysis tool now creates a new sample of size 27 (the size of the original sample) by randomly drawing 27 elements from the original sample with replacement and places the first 10 in the New group, the next 9 in the Old group and the remaining elements in the Control group. It now calculates the F-stat for this new sample. This is repeated 10,000 times (since Iterations is set to 10,000 in Figure 2).
For each iteration, the data analysis tool determines whether the bootstrap F-stat is larger than 2.109681 (the F-stat for the original sample). The p-value for the test is equal to the count of bootstrap F-stats > 2.109681 divided by 10,000. As we can see from Figure 3, for Example 1, p-value = .1452 (cell P26). Based on α = .05, this means that we cannot reject the null hypothesis that the three groups have equal means.
Observation: The analysis can also be done using randomization. The approach is identical to that described above, except that the samples of size 27 are done without replacement (e.g. by using the SHUFFLE function instead of the RANDOMIZE function).
Alternatively, the sampling can be performed on the residuals (i.e. the raw data minus the appropriate group mean) instead of the raw data, using either bootstrapping or randomization. For Example 1 this can be done by selecting the ANOVA (via errors) option in the Resampling dialog box as shown in Figure 2. The output from the randomization version of the test is shown in Figure 4.
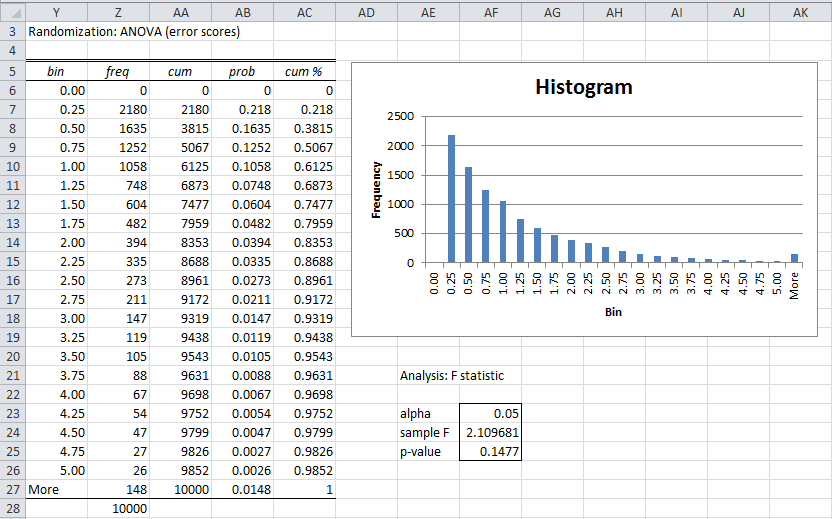
Figure 4 – Randomization test on residuals for ANOVA
Dear Charles,
the message “Input range 1 must have two columns if Input range 2 is empty” results when I run an independent samples test on medians (9 groups/columns) using the boostrap procedure. Group sizes range from 12 to 106 and there are some missing values. I wonder why your example with 3 groups/columns worked, while my test does not work.
Plase help me to solve the problem. Thank you very much!
Best regards,
Mauro
Hello Mauro,
If you have 9 groups, then you shouldn’t use the independent samples test on medians, which is limited to two columns (i.e. a bootstrap version of the t-test).
Instead, you should use the ANOVA version of bootstrapping, as shown in Figure 1 of this webpage. Instead of 3 columns, you will use 9 columns of data.
Charles
Dear Charles,
thank you very much for your response.
Do you think that the ANOVA version of boostrappig is problematic with strongly unbalanced group sizes? Some years ago I read an SPSS document that supported the use of non-parametric tests whit Monte Carlo or Boostrapp in case of strongly unbalanced group sizes. This is why I searched for a Kruskal-Wallis version of boostrapping but I thnk it is not included in the resampling procedure. Am I right?
Hello Gian Mauro,
I don’t know which is better ANOVA bootstrapping or KW bootstrapping with unbalanced data. Perhaps the following will be helpful:
http://bayes.acs.unt.edu:8083/BayesContent/class/rich/articles/Analysis_Of_Small_Sample_Size_Studies_Using_Nonparametric_Bootstrap_Test_With_Pooled_Resampling_Method.pdf
https://stats.stackexchange.com/questions/283170/when-is-unbalanced-data-really-a-problem-in-machine-learning
https://www.kdnuggets.com/2017/06/7-techniques-handle-imbalanced-data.html
Charles
Dear Charles,
I have just read that parametric bootstrapping is not equivalent to nonparametric bootstrapping. Thus, I wonder if bootstrapping for ANOVA is parametric and bootstraping for the Kruskal-Wallis test is nonparametric, or if the bootstrapping procedure is the same.
Is there a bootstrapping (Monte Carlo) procedure for the Kruskal-Wallis test in Real Statistics?
Hello Gian Mauro,
1. Bootstrapping for ANOVA is non-parametric
2. Bootstrapping for Kruskal-Wallis is also non-parametric. I doubt that this approach is widely used. I would imagine that it is performed in a similar manner as ANOVA bootstrapping, but using the KW test statistic.
3. Real Statistics does not provide KW bootstrapping.
Charles
Dear Charles,
I have run an independent samples test using the median statistic (KW?) and the bootstrap procedure for testing differences across 9 groups of different sizes (from n=12 to n=46) but the result is the following messagge: “Input range 1 must have two columns if Input range 2 is empty”. Given that there are 3 groups (columns) in the example, I wonder why the procedure does not run with 9 groups.
Best regards,
Mauro
See my response to your later comment.
Charles
Charles
I need to be able to do a post hoc multiple comparison in Anova after the randomization procedure. The data is not independent within each group. Can these be done in Excel.
Thank you for any advice
Hello John,
You can perform a variety of post-hoc comparisons (contrasts, Tukey-HSD, Games-Howell, etc.) using the Real Statistics add-in to Excel.
The fact that the data is not independent within each group is concerning for the validity of any of the tests. Is there some reason why the data is not independent within a group (e.g. same subject at different times)? Some of these issues can be dealt with, but I would need to know more details.
Charles
Thank you Charles, I’d appreciate if you could tell me how to do post-hoc comparison after the resampling ANOVA. Is it just like the Follow-up Tests to Kruskal-Wallis on your websites?
Ines,
It depends on why you chose to do resampling as to which of the standard follow-up tests to use. You can also use resampling for follow-up testing.
Charles
Thank you Charles. My situation is very similar to that in Fig. 1, which the data violates the homogeneity of variance assumption.
I did KW test and the follow up test (Dunn’s test), and I just want to know if another method (resampling) will get the same result.
What do you think?
You said that I can also use resampling for follow-up testing. If so, do I need to consider p value correction (Bonferroni-like correction)?
Thank you !
Ines
Ines,
Probably Welch’s ANOVA is your best choice.
Charles
Is there a way for your program to do boostrapping in a Two Way Anova?
Nick,
The Real Statistics software does not yet provide a bootstrapping capability for Two/way Anova. You can use the approach described on the website for one-way Anova for two-way Anova.
Charles
Dear Charles,
I got a problem using the Resampling tool for ANOVA. When I was filling the dialog box (just like your example), Excel told me that alpha must be a number between 0 and 5, and the Bin Size could not be a decimal number, because the tool gives an error. So, I had to put 1. Could you help me?
Thanks a lot!
Gustavo,
These sorts of error messages result from the fact that the decimal symbol (comma vs period) in default values is not being recognized correctly. I have tried to correct this, but it seems to be difficult to do this in all the various languages that Excel supports (and the various ways of assigning default values).
Generally, the solution to the problem with alpha is to re-enter the value (i.e. ignore the default value). Thus, if the default value of alpha is written as .05 (or even ,05), simply re-enter this value using whatever convention is typical for your version of Excel (i.e. .05 or ,05).
Regarding the bin size, you should be able to enter a decimal value, using whatever decimal symbol is typical for your version of Excel (i.e. comma or period).
Charles
Hi,
I want to compare two/three grroups with different sample sizes for results of an intelligence test (general results and results in test-factors (verbal, quantitative, nonverbal). Which statistic I need?
Kind regards Manfred
Manfred,
As always it depends on what you are trying to analyze. If you are comparing the intelligence scores of two groups (i.e. two independent variables), you probably want a two sample t test. With 3 groups, you probably want ANOVA. But since you have three dependent variances MANOVA looks to be the likely test. The t test doesn’t require that the two samples be equal in size. You can use ANOVA even if the samples are unequal in size, but then you will need to use regression to do the analysis. MANOVA requires that all the samples be equal in size, although if there are only two groups then you can use Hotelling’s T-square test, which doesn’t require that the samples have the same size.
All these tests are described in the Real Statistics website and are included in the Real Statistics software.
Charles