Basic Concepts
Kendall’s coefficient of concordance (aka Kendall’s W) is a measure of agreement among raters defined as follows.
Definition 1: Assume there are m raters rating k subjects in rank order from 1 to k. Let rij = the rating rater j gives to subject i. For each subject i, let Ri = 

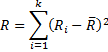
Now define Kendall’s W by
![]()
Observations about the formula for W
For each rater j
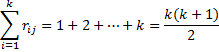 and so the mean of the Ri can be expressed as
![]()
By algebra, an alternative formulation for W is
![]() where
where
![]() If all the raters are in complete agreement (i.e. they give the same ratings to each of the subjects) then
If all the raters are in complete agreement (i.e. they give the same ratings to each of the subjects) then
![]() But
But
![]()
(see proof of Property 2 of Wilcoxon Rank Sum Test), and so
![]()
If all the Ri are the same (i.e. the raters are in complete agreement), then as we have seen, W = 1. In fact, it is always the case that 0 ≤ W ≤ 1. If W = 0 then there is no agreement among the raters.
Hypothesis Testing
Property 1: When k ≥ 5 or m > 15, m(k–1)W ~ χ2 (k–1).
We can use this property to test the null hypothesis that W = 0 (i.e. there is no agreement among the raters).
Example 1: Seven judges rank order the same eight movies with the results shown in Figure 1. The average rank is used in cases of ties. Calculate Kendall’s W for this data and test whether there is no agreement among the judges.
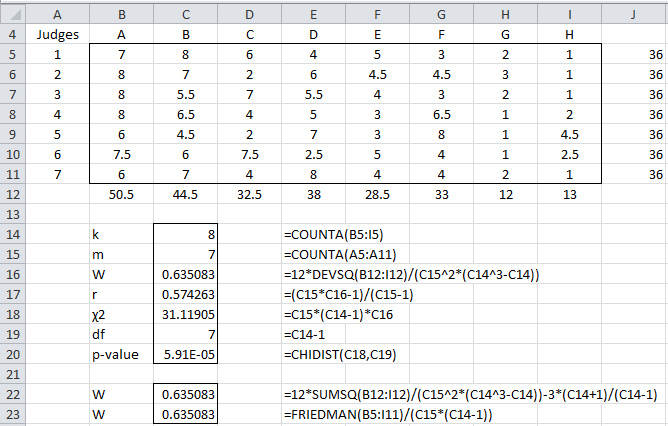
Figure 1 – Kendall’s W
We see that W = .635 (cell C16), which indicates some level of agreement between the judges. We also see that (cell C18) and that the p-value = 5.9E-05 < .05 = α, thereby allowing us to reject the null hypothesis that there is no agreement among the judges.
Note too that we calculated the sums of the values in each row of data to make sure that the data range contained ranked data. Since there are 8 subjects the sum of rankings on each row should be 1 + 2 + ∙∙∙ + 7 + 8 = 8 ∙ 9 / 2 = 36, which it does.
Observations
W is not a correlation coefficient and so we can’t use our usual judgments about correlation coefficients. It turns out, however, that there is a linear transformation of W that is a correlation coefficient, namely
![]()
In fact, it can be shown that r is the average (Spearman) correlation coefficient computed on the ranks of all pairs of raters.
For Example 1, r = .574 (cell C19).
In cell C22, we show how to compute W based on the alternative formulation for W given above. What is quite interesting is that the χ2 value for W given above is equal to the χ2 value used for Friedman’s test. Since we can calculate that value using the supplemental formula FRIEDMAN(R1), by Property 1, it follows that
![]()
For Example 1, this calculation is shown in cell C23.
Worksheet Function
Real Statistics Function: The Real Statistics Resource Pack contains the following array function:
KENDALLW(R1, lab, ties): returns a column vector consisting of and p-value where R1 is formatted as in range B5:I11 of Figure 1. If lab = TRUE, then instead of a 5 × 1 range the output is a 5 × 2 range where the first column consists of labels; default: lab = FALSE. If ties = TRUE then the ties correction as described below is applied (default = FALSE).
For Example 1, KENDALLW(B5:I11, TRUE) returns the output shown in Figure 2.
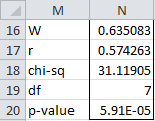
Figure 2 – KENDALLW output
Data Analysis Tool
Real Statistics Data Analysis Tool: The Reliability data analysis tool supplied in the Real Statistics Resource Pack can also be used to calculate Kendall’s W.
To calculate Kendall’s W for Example 1, press Ctrl-m and select the Interrater Reliability option from the Corr tab of the Multipage interface as shown in Figure 2 of Real Statistics Support for Cronbach’s Alpha. If using the original interface, then select the Reliability option from the main menu and then the Interrater Reliability option from the dialog box that appears as shown in Figure 3 of Real Statistics Support for Cronbach’s Alpha.
In either case, fill in the dialog box that appears (see Figure 7 of Cohen’s Kappa) by inserting B4:I11 in the Input Range and choosing the Kendall’s W option. The output is similar to that shown in Figure 2.
The Real Statistics Interrater Reliability data analysis tool also contains a Kendall’s W with ties option. When this option is selected, the ties correction described next is applied.
Handling Ties
The definition of W is appropriate unless there are a lot of ties in the rankings. When there are a lot of ties, the following revised definition of W can be used.
Definition 2: For each rater j, define
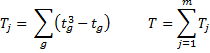
where the g are all the groups of tied ranks for rater j and tg = the number of tied ranks. E.g. for judge 1 in Example 1, there are no ties and so T1 = 0. For judge 2 there is one group of tied ranks (for 4 and 5) and so T2 = 23 – 2 = 6. Similarly T3 = T4 = T5 = 6. For judge 6 there are two such groups and so T6 = 6 + 6 = 12 and for judge 7 there is one group with three ties (3, 4, 5) and so T7 = 33 – 3 = 24. Thus T = 0 + 6 + 6 + 6 + 6 + 12 + 24 = 60.
Now define W as follows.
![]()
Example with Ties
Example 2: Repeat Example 1 taking ties into account.
The calculations are shown in Figure 3.
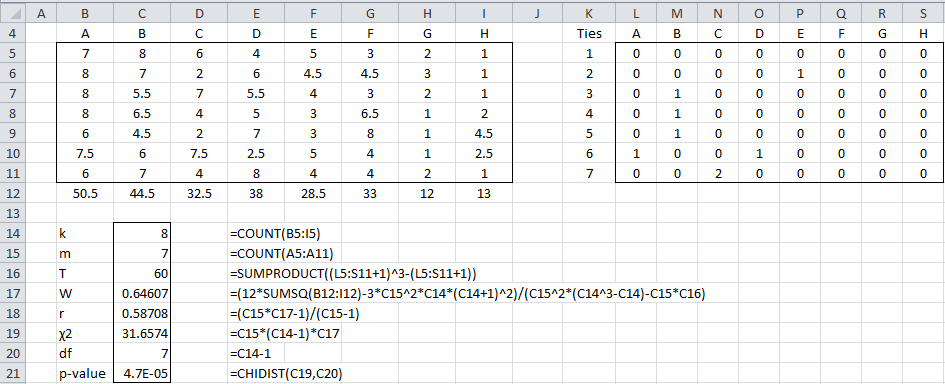
Figure 3 – Kendall’s W with ties
Here we handle the ties using the same approach as in Example 3 of Kendall’s Tau. In particular, the non-zero cells in each row of the range L5:S11 will correspond to the first element in a group of ties. The value of each such cell will be one less than the number of ties in that group. E.g. cell L5 contains the formula
=IF(COUNTIF($A5:A5,B5)=0,COUNTIF(C5:$J5,B5),0)
If you highlight the range L5:S11 and press Ctrl-R and Ctrl-D you will fill in the whole range with the appropriate formulas. This works provided the cells in A5:A11 and J5:J11 are blank (or at least non-numeric). Cell C16 will contain the formula to calculate T.
We see that the value of W hasn’t changed much even though we have quite a few ties.
References
Legendre, P. (2005) Species Associations: The Kendall Coefficient of Concordance Revisited. American Statistical Association and the International Biometric Society Journal of Agricultural, Biological, and Environmental Statistics, Volume 10, Number 2, Pages 226–245
https://pdodds.w3.uvm.edu/files/papers/others/2005/legendre2005a.pdf
Wikipedia (2014) Kendall’s W
https://en.wikipedia.org/wiki/Kendall%27s_W
Dear Charles,
First, I really appreaciate your page.
I have a data set with 80 subjects. I have also 3 raters. Each subject was evaluated based on 12 item (0-5). That means I have 80*12= 960 answers to score. However, after 90 SPSS programme only shows me N=2 raters. Before 90, O can see N=3. I am really confused. My original data consists of 430 subjects and i just wanted to calculate this test between raters.
I hope that these are enough to comprehend the situation better.
Thank you in advance,
Leyla
Hi Leyla,
I don’t use SPSS, and so I don’t know why SPSS would do this.
Did you try using the Real Statistics capability?
Charles
Hi Charles
Excellent explanation…very much appreciated.
I’m still unclear if Kendall’s W would be appropriate to be used in my study. I would appreciate your input.
I developed an instrument to assess pre-service teachers’ perception of STEM education. To establish the validity of the instrument I intend to have the items reviewed by 6 STEM Experts. The experts will be asked to use a 5-point Likert scale to provide feedback on content/construct validity of the items of the questionnaire.
Can I use Kendall’s W to establish the level of agreement among the Experts from the data obtained from the Likert Scale?
Hello Hope,
It seems that Krippendorff’s Alpha, Gwet’s AC2, or the Intraclass Coefficient might be a better fit for this situation.
All of these are described on the website. See https://real-statistics.com/reliability/
Charles
Hi Charles,
Thank you for taking the time to assist me with this… very much appreciated.
All the best!
Dear Charles,
Thank you for the great walkthrough.
I am trying to understand (and properly cite) the linear transformation from kendall W to pearson r. Unfortunately my mathematical understanding is limited. Do you have any additional source/further reading recommendation?
Cheers,
Robin
Dear Robin,
Thank you. I am pleased that you found it useful.
The first reference on this webpage contains two references that explain this linear transformation in more detail.
Charles
Hello! I would like to know why my W is under 0.2 even if a majority of raters (90%+) scored items with high values?
Danilo,
I would need to see your data to be able to say why W is less than .2.
Charles
if I wanna analyze about 15 raters who rating of 3 samples, each have 5 subjects and 3 replicates. has that equation changed ?
This approach doesn’t work if there are replications.
Charles
hello, thank you for your explanation. Its helping me to understand about this methods.
I have some question, if I have 15 raters, those raters ranking of 3 samples, each have 5 subjects, and do 3 replicates. Has anything changed from that equation ?
This approach doesn’t work if there are replications.
Charles
can you explain to me why it doesn’t work if there are replications ?
I do in Minitab, there are provide to create worksheet AAA with some replications. Here link if need it (https://support.minitab.com/en-us/minitab/18/help-and-how-to/quality-and-process-improvement/measurement-system-analysis/how-to/attribute-agreement-analysis/create-attribute-agreement-analysis-worksheet/perform-the-analysis/specify-the-data-collection-variables/?SID=88680#specify-the-number-of-replicates)
I am completely don’t understand how to analyze it manually.
I looked at the link you sent me. It is about the Attribute Agreement Analysis Worksheet. I don’t know what this is or whether this is the same as Kendall’s Coefficient W.
Charles
Can I apply Kendall’s W to a single choice set with multiple judges?
Hi Mark,
If by a single choice set, you mean one subject, then no you can’t apply Kendall’s W.
Charles
400 farmers are to thank 8 challenges they face in their farming business, how will go about it using the Kendalls coefficient of concordance?
Hello Daniel,
How is “thanking” measured?
Charles
Thank you for your clear explanations!
I hope you might be able to provide some advice regarding any extension of Kendall’s W for more complex designs? We have a multi-level design which seems to fit with the underlying logic of calculating Kendall’s W, but with an additional design factor to consider.
Specifically, 10 participants were each rated on 3 separate occasions, and the rank order of 5 variables was collected on each of these occasions. We are interested in whether there is an overall consistent rank for all participants? Or is it consistent only within each individual? Or is there no consistency at all?
Could you provide any advice on an appropriate approach to assess these questions with this design? Thanks very much for any help you can provide.
Are you saying that the 10 participants are rated by 3 raters or by one rater at three different times?
Are you saying that each participant is rated based on 5 different characteristics?
Charles
Many, many thanks for your superb explanations here. For rating videos of psychotherapy sessions, we have defined a set of 12 orthogonal qualities, each with a 5-level ordinal scale, and we would be very grateful for your advice regarding (a) the minimum number of raters necessary for reliably establishing IRA, and (b) whether Kendall’s W or ICC would be best for calculating IRA, or some other method. (Perhaps the latter question is answered by your Feb 14, 2019 reply to Vikramsinh, whose situation seems similar to mine; you indicated that “Gwet’s AC2, Krippendorff’s alpha or probably even ICC might be a better fit for your needs” than Kendall’s W.)
Hello Bruce,
By IRA do you mean interrater agreement? Gwet’s AC2 is probably a reasonable choice. The minimum number of raters is two.
Charles
After submitting the post above, I read your Feb 14, 2019 reply to Vikramsinh, whose situation seems quite similar to mine, so perhaps your reply there answers my item (b): You indicated that “Gwet’s AC2, Krippendorff’s alpha or probably even ICC might be a better fit for your needs” than Kendall’s W. Is that correct?
Bruce,
That is correct. Whether to use Kendall’s W depends on the nature of your data (as described on the webpage).
Charles
This is very useful and thanks to the teacher
Please can you give me an example on reporting the results of Kendall coefficient of concordance in APA style
See https://www.slideshare.net/plummer48/reporting-kendalls-tau-in-apa
Charles
Hi Charles
Thank you for your all effort to provide such an informative content.What am wondering is that:
Can Kendall’s Coefficient of Concordance be used to nonparametric correspondence of ICC (Intraclass Correlation Coefficient) for a data from three repeated measurements of one group of people (12 person) with the only one instrument resulting with non-normal data? (Because of ICC assumes normal disribution) If it is possible , how to calculate Standart Error of Measurement (SEM) parameter. (note: SEM is calculated as SEM=SD*(Square-root of (1-ICC) ). Here SD: Standard Deviation of Pooled Data
You can’t use Kendall’s Coefficient of Concordance for this purpose.
Charles
Hello, Charles, thank You for the Material in Your page. I have a question. I got time estimations (in days) from 9 experts. All estimations are different and are between from 1 day to 150 days to complete that task. My question is: Is it possible to calculate Kendall concordance coefficient or chi (with excel or another kind of program) when all the number differentiates so much?
My idea is to introduce some kind of evaluation system. For example: if an expert give 1-5 days to complete task (very little time, 1 point), if 6-10 days (little time, 2 points), 11-15 (average time, 3 points) etc.
Hello Paul,
If I understand correctly, the ratings are numbers x from 1 to 150 (or possibly (x+1)\5 where “\” is integer division).
Kendall’s coefficient doesn’t seem like the best metric for this. Perhaps you can use ICC, Krippendorff’s or Gwet’s-
Charles
Hi Charles,
Many thanks for this guide.
I would like your help on the following:
I carried out a Delphi Study and read Kendall’s W is the most appropriate method to test agreement.
I have 9 judges and 11 items. Not all judges rated all 11 items, some left 2 or 3 out. I have 6 judges that rated all 11. Can I still use the analysis, even though some items are left blank?
Many thanks!
Caroline
Hello Caroline,
1. I don’t know of a way to use Kendall’s W with missing data except to only include the ratings for the 6 judges (or to eliminate some of the 11 items). There are other tools that work with missing data as described at
https://stats.stackexchange.com/questions/270068/agreement-among-raters-with-missing-data
2. Gwet’s AC2 is one of these tools and it is supported by Real Statistics
3. If data is missing not randomly, then perhaps you can assign a rank and so retain more of the data. In this case, you would need to know why the data is missing. E.g. if the item is missing because the rater hated it then you can assign it the lowest rank
Charles
hi
many thanks for your educational page
Could you please do a practice with a Likert scale in the Delphi method?
Hello Erfan Reza,
You can use any of the reliability tests at each stage of the Delphi method. Do you have a particular scenario in mind?
Charles
السلام عليكم
Hi Charles,
are there a link between Kendall’s Coefficient of Concordance and Cohen’s Kappa -Estimating Inter-Rater- in Reliability .
it s mean can we find Reliability using Cohen’s Kappa from Kendall’s Coefficient
Hello Tahar,
I don’t know of such a link, although there may be one (at least in the case of two raters).
Charles
Hi Charles,
thank you very much for this informative post. I have multiple lists of ranked items, however, the lists do not necessarily have to contain the same items, it could even be that they agree in no item at all, e.g. Ranking1: [G1, G2, G3, G4]; Ranking2: [G1, G5, G7, G2]; Ranking3: [G9, G5, G2, G11]
Is it possible (and reasonable) to apply Kendall’s W here? How do I represent the items that have no rank assigned in a particular ranking?
Thanks,
Cindy
Hi Cindy,
Are you saying that each judge rates the same number of items, but the items may not be the same from judge to judge?
Charles
Hi Charles,
I have a similar problem.
I have n raters (32) who rated 40 items, and chose top three and bottom items on preference – in two ways, digital display and on physical cards.
SO similar to Cindy’s question, I am comparing two datasets with 3 number of items (each for positive and negavtive) but they are not always the same.
Could I use Kendell’s coefficient to compare these data sets?
Could I spread all 40 items in a spreadsheet and rank only the ones rated 1,2,3 by the rater and leave the rest blank? Please suggest.
Hello Ayesha,
What is your objective? Is it (1) to determine whether ranking using digital displays is higher than physical cards, or (2) the 32 different raters tend to agree or (3) something else?
Charles
Hi Charles,
Thank you for your post.
Having read the comments on this page, I notice that it is possible to use Kendall’s W as well as Krippendorff’s alpha to assess concordance, dependent on the dataset you wish to analyse.
I am confused however, as to which I should use and when. Is there a simple way to determine this as I can find very few sites that provide a direct comparison?
I hope you can help.
Many thanks
Lauren
Lauren,
It is usually more difficult to make the data fit Kendall’s W, but if the data does fit then there is no simple answer for which tool to use. Actually, I prefer to use Gwet’s AC2 (which is similar to Krippendorff’s) since it doesn’t suffer from many counter-intuitive results. Probably the simplest answer to your question is to use the applicable tool that is most commonly used in your field since that will be the tool that will carry the most weight among your audience.
Charles
Hi Charles,
Thanks for your prompt response.
Sorry, I’m no whizz when it comes to statistical analysis so I hope you don’t mind me asking a further question. You mention it is hard to make the data fit Kendall’s W; is this because of missing values or for some other reason?
Given your comment that it is best to use the applicable tool that is most commonly used in your field, I will no doubt opt for Kendall’s W.
I really appreciate your advice here.
Many thanks
Lauren
I have 25 independent criteria. Each being evaluated independently by 5 judges in the scale of 1 to 5.
Can I use concordance test to evaluate the degree of agreement among the judges. If yes, How do I go about it.
Dear Vikramsinh,
Yes, you can use Kendall’s W in this case (although as I mention later it is not the best tool for the job). To prepare the data, recall that each row contains the ratings for one rater and each column contains the ratings for one subject. Thus you need 25 columns and 5 rows. Once you fill in the Likert ratings that you have for each combination of rater and subject, you have one further problem. Kendall’s W can’t use the Likert ratings but instead the ranks of these values in each row. Suppose that your Likert scores are contained in the range A1:Y5 (with no row or column headings). You need to construct a new 5 x 25 range say in range A7:Y11 containing the ranks for each row. To do this, place the formula =RANK.AVG(A1,$A1:$Y1,1) in cell A7. Then highlight the range A7:Y11 and press Ctrl-R and Ctrl-D (to copy this formula into the entire range). Now range A7:Y11 contains the data in the correct format. You can use this as the input to the Kendall’s W with ties option on the Real Statistics Interrater Reliability data analysis tool.
Although you can use Kendall’s W for this job, as you can see, you need to transform the data to make it fit the tool. I suggest that you use a different interrater reliability tool. Gwet’s AC2, Krippendorff’s alpha or probably even ICC might be a better fit for your needs. Each of these is also supported by the Real Statistics website and software.
Charles
Hello Charles ,
Your valuable input has been very helpful.
Thanks a ton.
Vikramsinh
hello sir is it essential to having more than 30 variable to apply this in research?
Sorry, but I don’t understand your question. What are you referring to?
Charles
Additionally could you please send me the link to calculate the correlation value ?
Thanks,
Ayda,
This webpage contains the formula, namely r = (mW-1)/(m-1).
Charles
in my project I found :
Kendall W=0.003 with p= 0.52 and Kendall W=0.13 with p=0.000
So how can I interpret these results?
Could you help me please ASAP?
Thanks!
Ayda,
In order to interpret Kendall’s W, I suggest that you calculate the correlation value (as described on the webpage) and then you the usual approaches for interpreting the correlation coefficient (close to 1 represents a high level of agreement).
If the p-value is low, then it is unlikely that there is no agreement (i.e. W = 0).
Charles
Hi Charles,
You mean that interclass correlation, right?
And we will use correlation value instead of Kendall’s W to interpret level of agreement?
Thank you !
Ayda
Ayda,
No, I was referring to the value defined on this webpage, namely r = (mW-1)/(m-1).
Charles
I need help very urgently.
please I want to use Kendall’s W to rank some Policies ( 8items ) to analyze which policies best affect Agriculture in Ghana. with sample size of 50 people (respondents). please how do I go about it.
Thank you
Patty,
How to go about it is explained on this webpage. Do you have a specific question?
Charles
Dear Charles
I have 7 raters and 19 subjecs, raters rate subjects in likert scale (1 t0 10). I changed the Likert scale values into a rank order and have lots of tied!
My W is equal 0.35.
Guide me please, is Kendall’s W good for me? can i use mean “only” for expres agreement in this situation?
Alireza,
This approach should be good. Make sure that the sum of the ratings for each subject is the same. There is no agreement about what is a good value for W, but it does seem low to me.
Charles
Dear Charles,
The definition of null hypothesis in this article is confusing me. SPSS defines null hypothesis for Kendall W as “The distributions of variables are the same”. This definition look completely opposite to the way you defined the null hypothesis “there is no agreement among raters”. Can you please explain, because my whole analysis is going upside down.
P.S. If the null hypothesis is rejected/accepted, does it lead to acceptance/rejection of W as well?
Regards.
Mohsin,
I don’t use SPSS and so I can’t comment on that. The approach I am using is consistent with that described in Wikipedia (https://en.wikipedia.org/wiki/Kendall%27s_W) and other sources (see for example http://www.statisticshowto.com/w-statistic/)
Charles
Dear Charles,
I had run the Kendells W test….tho the p value came out to be significant however the value of Kendells W is very low….is it valid…
Reeti,
This depends on a lot of things. E.g. if the sample size is very big, then it is likely to get a significant result even when W is low.
Charles
Hi Charles,
I got a similar situation, but my W value is 0.65 and m =3. is that acceptable?
Ohh I forgot to tell n=4… they are 4 factors to evaluate
Hello Lizzy,
I suggest that you use the template shown in Figure 1 to calculate the p-value. One caution: when calculating W, make sure that the sum of the values in each row has the same value (as is the case in Figure 1).
Charles
Hello Charles,
I am carrying out a research with 4 different respondents and they are to rate some factors using the likert scale of 1(strongly disagree) to 5(strongly agree). the first set of respondents are 375 in number, the second set is 26, 3 set of respondent is 1 and the last set is also 1. At the end of analyzing for each sets of respondents, i want to combine the 4 set together to get an overall rating for the factors. can i use kendall’s coefficient of concordance to combine the 4 together to get overall rating? waiting for ur reply.
I don’t have a suggestion for how to combine multiple rating coefficients. It really depends on what you plan to use the result for. For some contexts the minimum might be appropriate. Perhaps the mean, although it is hard for me to fathom what use this might have.
Charles
Dear Charles
I think this question has been treated before but I’m not able to make the function RANK_AVG work correctly (I use excel for Mac, release 3.5.3 of the resource pack)
Situation: 7 judges are rating 8 items (using likert scale from 1 to 4 to valuate how appropriate is each item, 1=Non appropriate, 4=Very appropriate)
As the sum is different in each row, I guess I have to first use RANK_AVG.
In B13 I enter =RANK_AVG(B5:I5) but got #¡VALOR!
What I’m doing wrong? Could you please help me?
Javier,
I really can’t say without seeing your data. If you send me an Excel file with your data and analysis, I will try to figure out what has gone wrong. You can find my email address at
Contact Us
Charles
Hi,
I am running a validation study in which I compare two measures of the same process. One variable is continuous (EMG data in microVolts), the other is categorical (5 increasing categories). I want to assess the agreement between the two measures, but am doubting what method to use… Would Kendall’s W be an option?
Nina,
Bland-Altman is a commonly used approach for comparing two measurements of the same variable. See the following webpage for details:
https://real-statistics.com/reliability/bland-altman-analysis/
I am not sure how you plan to compare a continuous measurement with a categorical (actually ordinal) measurement, though.
Charles
Dear Charles,
is it possible to calculate Kendalls W with some not avaliable (NA) ratings for some rater or is it necassary that all ratings are avaliable (fully crossed desing)?
Tanks al lot!
Peter
Peter,
What sort of ranking would you assign to NA?
To avoid this problem, you should consider using Krippendorff’s Alpha or Gwet’s AC2.
Charles
Dear Charles,
thanks for this website. your help is much appreciated.
I have used Kendall’s coefficient, it worked well in my case. My problem is that I have been told that each use of Kendall’s coefficient must be tested for significance. No further explanation is given.
Could you please be so kind and provide me with any hints to what that means and how I do that?
Thank you in advance
Katerina
Dear Katerina,
This is the p-value. If the value is less than some predesignated value (usually alpha = .05), then the test is viewed as significant (in this case, all it means is that W is significantly different from zero).
The calculation of the p-value is described on the referenced webpage.
Charles
Thanks for the great site!
I’m conducting a survey (as part of a Delphi process) asking m experts to rank, by priority, only the top 5 items from a list of 21. Rankings are from 1-high priority to 5-lowest priority.
I was planning to test agreement between the experts using Kendall’s W, but am quickly realizing this may be a problem as I don’t have the full 21 rankings for each expert. Each expert rated 5 different items then the next..
Could I supplement a “6” rating for the items each rater did not rank and perform the test? if not – any other ideas for me?
thanks again!!!
Anne
Anne,
I guess not ranking in the top 5 is a sort of ranking, and so this approach seems to make sense. Do you think a rank of 6 captures the relative weight properly. If not you might need to make the 6 higher.
You might also consider other inter-rating approaches (Krippendorff’s alpha or Gwet’s AC2). I don’t know whether these measures will deal with your situation better, but it might be worth looking at them. The latest release of the Real Statistics software (released today) supports both of these tests.
Charles
Thank you for this super informative and quick reply! will look into it as suggested
Anne
Amazingly amazing!
Our answers matched for W = 0.6351 (rounded off to four decimal places). I solved it manually by hand using a pen, paper, calculator, and Kendall’s W formula.
Hi Charles
Can we use W for founding concordance between two quantitative test with two type of metrics? two method evaluate risk quantitatively. one method is standard and have four cut point (lead to low risk to high risk). but other method is new and we want to find its validity.
thanks
Maryam,
I don’t fully understand the scenario you are describing, but perhaps it is a fit for Bland-Altman.
Charles
Dear Charles
thanks for this awesome website. your help is much appreciated.
I have designed a tool and I am working on testing the content validity of this by tool by using 10 experts. the experts ranked 150 items related to the tool based on 5 points likert scale. could you please tell me which test do you recommend to test the inter rater agreement; weighted Kappa or Kendall’s W or fliess kappa (because the distance between the scale is not important for us, I am looking only for the relevant agreement (score 4 and 5))
Thanks
Enas,
Fleiss’ kappa is designed for categorical ratings. You are using ordered ratings and so the order will not be taken into account in Fleiss’ kappa. You might be able to use the intraclass correlation (ICC) instead or some form of weighted Fleiss’ kappa. Kendall’s W might also work. These approaches are described on the Real Statistics website.
Here is an article about weighted Fleiss’ Kappa:
https://www.researchgate.net/publication/24033178_Weighted_kappa_for_multiple_raters
Charles
Thank you so much Charles for your fast response.
the likert scale has a big conflict in the literature. I found articles considered it as interval data, others considered it as nominal and the most treated it as ordinal. so we lost when we wanted to choose which test should we use.
therefore, I am wondering if I wanted to use ICC, should I assume that my data is continuous variable.
Can I use Krippendorff’s alpha coefficient and Gewt’s AC1 as well to calculate the agreement between the experts.
thanks in advance for your time and effort
Kind regards
Enas
Enas,
I agree that there is some differences of opinion about how to treat Likert data
Treating it as a continuous variable and using ICC could be the way to go. The bigger the Likert scale the more reasonable this is (e.g. 1-7 is better than 1-5).
I know that Krippendorff’s alpha has some advantages, but I am not so familiar with this measure.
Charles
Thank you so much for your help
Enas,
Glad I could help.
Charles
Hi charles,
Im using delphi technique and have 10 judges rating 8 ( this varies according to different topics) on a likert scale of 1-5. I know you have suggested using rankavg but i’m kind of lost here.
please help
Arun,
Suppose your raw data is in range B5:I11 (as in Example 1 on the referenced webpage). If the sum of each row is the same, then there is no problem and you can simply calculate Kendall’s W. If not, then can place the array formula =RANK.AVG(B5:I5) in range B13:I13 and press Ctrl-Shft-Enter. Then highlight the range B13:I19 and press Ctrl-D. Now perform the analysis on the ranked data in range B13:I19.
Charles
Hi Charles, I have one issue about Kendall’s W. If I have 100 subjects, and each subject with score from 1 to 5 not with rank from 1 to 100. Do I need to do some transformation for these scores? Because from your proof, k subjects must be in rank order from 1 to k so that W will be between 0 and 1. So, what kind of transformation should I do? Thanks!
Aaron,
You can use the RANK.AVG function to map the scores 1 to 5 into 1 to 100. There will be a lot of ties.
Charles
Hi Charles,
Thanks for your help.