Basic Approach
When we have two samples coming from populations whose population variances are known, we can use the following property to determine whether the means of these populations are equal.
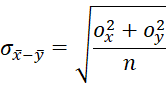
Property 1: Let x̄ and ȳ be the means of two samples of size nx and ny respectively. If x and y are normally distributed or nx and ny are sufficiently large for the Central Limit Theorem to hold, then x̄ – ȳ has a normal distribution with mean μx – μy and standard deviation
![]()
where σx and σy are the corresponding population standard deviations.
Proof: Since the samples are random, x̄ and ȳ are normally and independently distributed. By the Central Limit Theorem and Properties 1 and 2 of Basic Characteristics of the Normal Distribution, we know that x̄ – ȳ is normally distributed with mean
![]()
and standard deviation
![]()
Hypothesis Testing
When the populations are normally distributed or the sample sizes are sufficiently large, we can use Property 1 to compare two population means. The property requires that the population standard deviations be known, which is usually not the case. Often, especially with large samples, the standard deviation of the samples can be used as an approximation for the population standard deviations. We can instead employ the t-test (see Two Sample t-Test) which doesn’t require that the variances be known and is especially useful when the sample sizes are small.
Data Analysis Tool
Excel Data Analysis Tool: Excel provides a data analysis tool called z-Test: Two Sample for Means to automate the hypothesis testing process, as shown in Example 1.
Example
Example 1: The average height of 5-year-old boys in a certain country is known to be normally distributed with a mean of 95 cm and a standard deviation of 16 cm. A firm is selling a nutrient supplement that it claims will significantly increase the height of children. In order to demonstrate its claim, it selects a random sample of 60 four-year-old boys, half of whom are given the nutrient supplement for one year and half of whom are not. Given that the heights of the boys at 5 years of age are as shown in range A3:F13 of Figure 1, determine whether the nutrient is effective in increasing height.

Figure 1 – Two-sample test using z-scores
The right side of Figure 1 shows how to calculate the z-score for the difference between the sample means based on a normal population with a known standard deviation of 16 (i.e. a known variance of 162 = 256). Here the null hypothesis H0 is
![]()
or equivalently
![]()
This is a two-tailed test, which is why the p-value (in cell I12) is doubled. Since p-value = .008 < .05 = α, we reject the null hypothesis. Thus, we conclude there is a significant difference between the boys who take the nutrient supplement and those who don’t.
We can also use Excel’s data analysis tool to calculate the z-score from the sample data. Note that we must first reorganize the data in the form of either a single row or a single column. Figure 2 shows the output of the data analysis tool for Example 1.

Figure 2 – z-Test: Two Sample for Means data analysis tool
Looking at the two-tail results, we see once again that .008 < .05 (or alternatively |z| = 2.65 > 1.96 = z-crit), and so we reject the null hypothesis.
Effect Size
In the two-sample case, we define the Cohen’s effect size to be
![]()
where
![]()
When σ = σx = σy, then
![]()
If n = nx = ny, then
When σ = σx = σy and n = nx = ny, then
![]()
Examples Workbook
Click here to download the Excel workbook with the examples described on this webpage.
Reference
Howell, D. C. (2010) Statistical methods for psychology (7th ed.). Wadsworth, Cengage Learning.
https://labs.la.utexas.edu/gilden/files/2016/05/Statistics-Text.pdf
Minor point: In figure 1, in cell I11, you have (I5-J5)/I10. For two-tailed test, would it be better to use -ABS(I5-J5)/I10 so as to insure a negative z-score?
Hello Conor,
Yes, you are correct. I will shortly update this webpage and include your suggestion.
Charles
Hello,
Thank you for this analysis. However, in the example shown in Figure 1, why is the pooled standard deviation so low (4.13) compared to the population standard deviation (16)? In the pooled variance, you have divided by n of each sample, perhaps that is the issue? Am I missing something?
Thanks,
Ashish.
Hello Amish,
If you have a sample of size n from a population whose standard deviation is 10, then the expected standard deviation of the sample from the mean is 10 divided by the square root of n. This is for one sample. See
https://www.real-statistics.com/sampling-distributions/basic-concepts-sampling-distributions/
You are referring to the two-sample version of this.
Charles
Hi Charles, and thanks again.
Yes, after thinking about your post you are correct on both counts. If the data were normal, the means would certainly cluster very closely around the pop mean and the difference between std’s would be a very useful measurement. Which raises your other point. The flaw is that this data just isn’t normal. I originally made that assumption on the basis that large samples should tend to be so. Not the case here. When I re-bin the data over 8, 16 and 32 bins there is no visual semblance of normality and any test applied confirms it. Please advise if you can see a flaw in this reasoning; otherwise I’ll test non parametrically. Thanks for your guidance.
Regards
Anthony
Hello Charles
I am collecting digital data over 256 channels. I access three separate types of data in each channel so I can produce a histogram of the number of counts for each type of data across the channels. Each type can have thousands of counts per channel. I can calculate the mean and standard deviation for each histogram. I am not interested in comparing the means of the three types in terms of their counts because the nature of the source ensures they will always be almost equal. But I am very interested in comparing the channels where the different means occur. Can a valid test be applied to compare channels?
Thank you,
Anthony
I want to compare 2 means with standard ERRORS, I do not know n or standard Deviations
Rich,
Sorry, but I don’t understand the context of your question. Do you have two samples and want to compare the means of the samples? If not, please specify what information you have.
Charles
Charles,
Thank you for the reply. Suppose I wish to test if two dices have the mean and SD by taking large samples, the SD formula in the theorem increases it a factor of sqrt(2) compared with the single SD z test. The consequence is that the Theorem leads to a z-score lower by a factor of sqrt(2). Could you please comment on this. Many thanks in advance.
This is the way the mathematics works out, at least when the two samples have the same size and standard deviation. I guess one way to look at this is that with two samples you have added standard deviation from the mean (which in this case is the difference between two means).
Charles
Charles, Thank you very much for the article. I am new to application of statistics. I am writing a document on methods of measuring the uniformity of the distribution of sequences created by random number generators and irrational number. The theorem is just what I have been looking for. Your website will referenced. Does the Theorem have a name? Many thanks
z-Test: Two Sample for Means.
See Citation for how to reference the website.
Charles
Hi Charles,
2 Questions:
Since the question is…….”Is the nutrient significantly better at INCREASING height?”…….wouldn’t that imply a 1-tailed test and hence more appropriate to use NORMSINV(.05) to arrive at the most appropriate Z-Crit value?
You used NORMSDIST in this example, but omitted using NORMDIST. I re-ran the results using NORMDIST(95, 106.69, 4.131182, TRUE) and got a different answer. My intuition is that NORMDIST is best for 1 sample testing and not two sample testing, which is why you only used NORMSDIST instead. Am I correct here or is there something I’m missing?
Jonathan,
Just because you are interested in increasing height does not mean that you should use a one-tailed test. You could use a one tailed test, if you are certain that the nutrient won’t decrease height. Usually it is safer to use the two-tailed test.
NORMDIST(x, m, s, TRUE) is equivalent to NORMSDIST((x-m)/m) and has nothing to do with 1 or 2 sample testing. For the problem on the webpage, the equivalent version of the p-value using NORMDIST instead of NORMSDIST is =2*NORMDIST(95.74-106.69,0,4.13,TRUE).
Charles
Can you please help me solve the ff question: In Norway, the distribution of birth weights for full-term infants whose gestational age is 40 weeks and whose mothers did not smoke during pregnancy is approximately normal with mean 3500 grams and standard deviation 430 grams (Bellinger et al., 1995; New England Journal of Medicine 332:549-555). An investigator plans to conduct a study to determine whether or not the mean birth weight of full-term babies whose mother smoked throughout pregnancy is different from that of the non-smoking mothers.
Suppose the investigator believes that the true mean birthweight for the infants from smoking mothers could be as low as 3200 grams or as high as 3800 grams (i.e. he anticipates conducting a two-tailed test) with the true variability being the same within each of the two groups. He intends to design a balanced CRD (i.e. equal sample sizes) in weighing babies from randomly selected mothers from each of the two groups.
a) Now, the investigator wants to risk a 10% or less chance of failing to detect a mean difference between the two groups of mothers. Suppose the investigator intends to eventually analyze the data assuming that the variance(s) are known. What sample sizes per each of the two groups would needed for this study?
b) Obviously, the investigator will not able to assume the variance(s) as known when he analyzes the data and intends to publish the results. Readdress the question in (a) given this more normal circumstance.
c) What power would be afforded from sample sizes of 10 babies per each of the two groups if a conventional t-test was going to be used to analyze the data?
d) What should be the sample sizes for the two groups if the investigator desires the 95% t-based CI on the mean difference to be no greater than 50 grams?
Isaac,
If I understand your question properly, the four questions you are asking can be resolved as follows:
a) What is the sample size required for a test using the normal distribution? See the following webpages:
Statistical Power and Sample Size
Power and Sample Size using Real Statistics
b) and d) What is the sample size required for a t test?
Sample Size Requirements for t test
c) What is the power of a t test?
Power for t test
You can also use the Real Statistics Statistical Power and Sample Size data analysis tool to answer these sorts of questions, as described on the following webpage:
Real Statistics Statistical Power Analysis Tool
Charle
Thank you very much Charle!
Hi, I want to know how did you calculate population variance??
Hello,
Can I follow example 1 even if the sample sizes are different?
Basically I want to compare the mean of two samples with different sample sizes (in Excel). I have the mean, the variance and the sample size for both.
Thanks
Celina,
Yes, the sample sizes can be different.
Charles