Table 1 contains the weights ai for any given sample size n. Table 2 contains the p-values for Shapiro-Wilk Test. See Shapiro-Wilk Test for more details.
Table 1 – Coefficients


Correction: The a13 value for n = 49 should be 0.0919 instead of 0.9190.
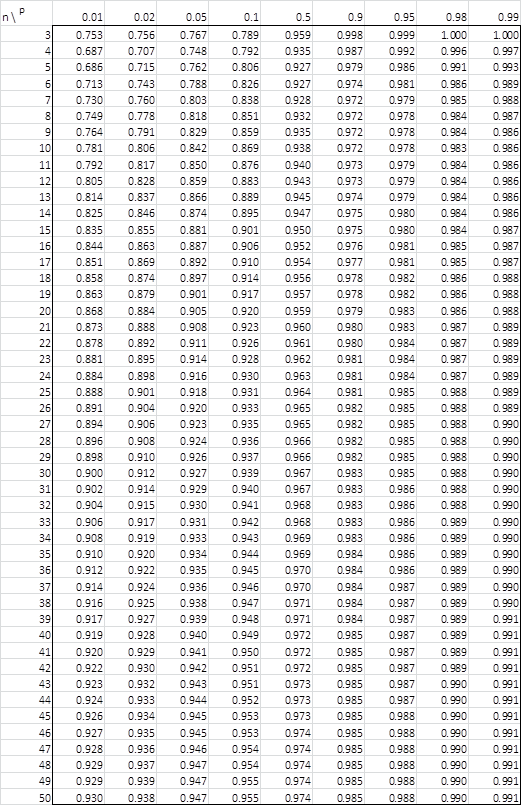
Table 2 – p-values
Links
Download Table
Click here to download the Excel workbook with the above tables.
Reference
Shapiro, S.S. & Wilk, M.B. (1965) An analysis of variance for normality (complete samples). Biometrika, Vol. 52, No. 3/4.
What should i do if i got oddd number of samples? Wouldn’t one data miss the ai?
Yes, you would not take the middle value into account.
Charles
How do i find the A1,..,A5 for a larger data sample my n/2=905
Hello Calum,
In this case, you can’t use the table. Instead, you need to use the Royston version of the Shapiro-Wilk test. See
https://www.real-statistics.com/tests-normality-and-symmetry/statistical-tests-normality-symmetry/shapiro-wilk-expanded-test/
Charles
Hello Charles,
Thanks much for the prompt response. I actually meant the complete Shapiro-Wilk tables.
On the other hand, after installing the Excel add-in from your website, I prefer using your
SW Extended Test tool for my application. Great time saver and very informative.
Is there a way to enlarge the rather small UI on a MacBook Pro 15″ Retina?
Let me also take the opportunity to thank you personally for creating this wonderful website on statistics with its rich assortment of useful tutorials, examples and tools. Keep up the good work.
Best regards
Peter
Hi Peter,
Thank you very much for your kind words about Real Statistics.
Regarding the size of the user interface on the Mac, please see
https://www.real-statistics.com/appendix/faqs/enlarge-dialog-box-on-mac/
Charles
Hi Charles,
Where can I find the SW tables in a format that allows copying of coefficient columns into my spreadsheet?
Peter
Hi Peter,
You should be able to copy the data on the webpage into an Excel spreadsheet. In any case, you can download an Excel spreadsheet with this table from the Goodness of Fit worksheet found at
https://www.real-statistics.com/free-download/real-statistics-examples-workbook/
Charles
Hola. Buenos días, Charles.
¿Podrías decirme si la “tabla 2” son valores a dos colas?
I believe this is a two-tailed test, although I don’t know what the null hypothesis for a one-tailed test would be.
Charles
Hi Charles,
how to find p-value table, for n=2 Shaphiro-Wilk Test?
Hi Riama,
There isn’t a Shapiro-Wilk test when n = 2.
How could you tell whether a sample with only two elements comes from a normally distributed population?
The value of a normality test with 3 or 4 elements is only marginally useful in my opinion, but two elements?
Charles
Good day, Sir,
I would like to compare the means between two independent groups: A (with N=2) and B (with N=25, normal distribution with Shapiro-Wilk).
-Should I assume that group A is not normally distributed (because we can’t test the normality) and go with Mann-Whitney test?
-Or should I assume that group A is normally distributed and go with Independent T test?
Also, for another case with group X (N=1) and group Y (N=26, normal distribution):
– can I use the same normal / not normal distribution assumption as the questions above (for N=2)?
– should I use independent 2-sample statistic test (Independent T-test / Mann Whitney Test) or instead use one sample statistic test vs. a reference mean (one sample T-test / Wilcoxon signed rank test)?
Thank you very much
Sincerely yours,
Lunardi
Hello Lunardi,
Where N = 2, I suggest that use both a two-sample t-test and Mann-Whitney to see if the results are similar.
Where N = 1, I suggest that you use the one-sample t-test using the hypothesis that the mean of the larger sample is the value of the sample with one element. This is appropriate if the larger sample is normally distributed. If not, then use the one-sample Signed-Ranks Test.
Charles
Thank you very much Sir for your advice and answers!
Sincerely yours,
Lunardi
Hello Charles,
I’m using the table for n=9. I got W=0.718, however the lowest on Table 2 is 0.764 for p value 0.01. Any idea on how to handle this problem?
Thank you.
Hello Dea,
This means that the p-value is less than .01, which is usually sufficient for most analyses.
If you want a more precise value, then I suggest you use the Royston version of the Shapiro-Wilk test, as explained at
Enhanced Shapiro-Wilk Test
Charles
Hello Charles,
I still don’t quite understand. It’s less than 0.01 so that usually means we reject the hypothesis that it has normal distribution with 99% certainty right? But you said that it’s sufficient. Could you please elaborate on that?
I tried the enhanced test but the NORMSINV formula can’t seem to work on my excel.
Thank you so much!
Hello Dea,
A p-value < .01 would usually be considered sufficient to reject the assertion that the data comes from a normally distributed population. I don't know why a formula using the NORMSINV function would not work. Perhaps you mean to use the NORMINV function. You could try the NORM.S.INV or NORM.INV function. Charles
Hi Charles,
I have searched for a while trying to find the tables in text form so that I can copy and paste them into excel and perform a vlookup function on them. I cannot find them other than in an image which would mean I would have to manually enter them. Any chance you could provide an excel file with the numbers entered? Thank you!
Hi David,
You can find the table in the Basics examples workbook. You can download it for free at
Download Examples Workbooks
Charles
Hi, Charles,
So I downloaded the file named “Real-Statistics-Examples-Basics”, but where is that table of coefficients?
Thank you very much.
It is in the Goodness of Fit examples workbook.
Charles
Dear Zaiontz,
With Shapiro-Wilk Original Test formula in your site, I will do Shapiro-Wilk Test.
If sample cnt is more than 50, how can I refer the coefficeints and P – value ?
The table above is only 50 but my sample is more than 2,000.
And what’s the difference between Shapiro-Wilk Original Test and Shapiro-Wilk Expanded Test ?
Best Regards,
Minhwa Lee.
Hello Minhwa,
The original test is the version that Shapiro and Wilk developed. It only handles up to 50 data elements. The expanded version was developed to expand the number of data elements up to 5,000. When you have more than 50 data elements I suggest that you use this latter version (it can also be used for 50 or fewer data elements).
Charles
Dear Charles,
Thank you for your prompt reply.
I have another question.
I ‘d like to know what data elements exactly mean on example below .
Which one is data elements ?
– Sample count = 10 : the number of units in each sample
– Lot count = 2,000 : the number of lots
– Sample count * Lot count = 20,000 : All raw data sorted
I am looking forward to hearing from you.
Thank you.
Example
Lot number raw data value
(lot couunt=2000) (sample count = 10 )
——————————————————————
Lot 01 2,4,4,3,6,5,3,4,5,3
Lot 02 3,5,2,3,6,5,3,4,5,3
Lot 03 3,4,4,7,6,5,3,4,5,3
…….
Lot 1999 4,5,2,3,6,5,3,4,5,3
lot 2000 4,3,4,7,6,5,3,4,5,
Hello Minhwa,
If you need to determine whether all the data are normally distributed then you need to test all 20,000 elements. What is considered to be the collection of data elements is not something I can answer; it depends on why you need to check for normally at all. If you need to determine whether all the data are normally distributed then you need to test all 20,000 elements.
Charles
Dear Charles,
Thank you so much your kindly reply.
I am sorry but I have another question.
Even though the concerned data elements of mine are more than 50(usually more than 1000), I want to use the original version because it has much less complicated formula than the expanded version.
If possible by original version, Could you advice me on how to refer to Coefficients and p-value ?
– how to test the large data by original version.
Thank you.
I don’t know how to use the original version with more than 50 elements.
Charles
Hi Dear Charles,
I am trying to create coefficient and p value tables in excel, can you please hint the formula that I need to enter?
Thank you
Hi Annie,
The table is taken from the original research article by Shapiro and Wilk (see Bibliography).
Charles
Hi,
I have a list of 500 numbers that I need to implement my own Shapiro-Wilk test code. That means I need to have 500 coefficients, right? If yes, how can I calculate them? I tried formula on wikipedia, but I could not made it. Thanks in advance for your kind help.
Hi, see the following webpage that explains how to do this.
Expanded Shapiro-Wilk Test
Charles
Hi Charles,
thanks for such a post. I am trying to test the normality of Dunn index values (of approx 30 results) obtained from several experiments. Since Dunn index values are fractional, the value of W (in my case it is 0.493, for n=30) is not even close to the values given in table 2. How should I proceed?
Aditya,
Since the W value (assuming no mistake in its calculation) is much less than the value in the table, the p-value is much lower than .01, which is a significant result, indicating that normality is not likely.
Charles
thank you, Charles.
Hi Charles,
I am unable to perform the Friedman Test in my Microsoft Excel 2007 version. How can I perform it? Is there any other way round to perform Friedman test?
Hi, what if I have n more than 50? How do u get the value of a? Please help me to answer this. Thankyou 🙏🏻🙏🏻🙏🏻
Eka,
In this case, you should use the Royston approach to Shapiro-Wilk. See
Shapiro-Wilk Test
Charles
Hi:
How can I get the degrees of freedom in this test?
Giovanni,
Degrees of freedom are not used for this test.
Charles
Have the similar issue. For some reason, internal examiner requested df values for a Shapiro-Wilk test (because, according to him, it is in APA guidelines). The issue is, the only software that points out df for SW is SPSS, which I do not use (I calculate in R). I have no idea what to do with that…
Dear Andrzej,
I rather doubt that APA requirements for Shapiro-Wilk include the df, but in any case, I looked at the results from SPSS.
It seems like they set the df to the sample size. I observed this at
https://www.spss-tutorials.com/spss-shapiro-wilk-test-for-normality/
Charles
Hi Charles,
Thanks a lot for the very helpful explanation.
However, I’m a bit confused.
For n=25, I obtain W=0.97, thus p-value of 0.6.
For alpha=5%, therefore, my hypothesis is not rejected.
However, the more I diminish the alpha (1%, 0.5%, etc.) the more the hypothesis is “not rejected” as alpha is further away from the p-value. I’m confused, shouldn’t it be harder and harder to have a “non rejection” when I diminish the level of error ?
Isn’t there a mistake and it should be that the p-value should be below alpha (and not higher than) for a non-rejection ?
Thanks for your help,
Thomas
Thomas,
The lower the value of alpha, the harder it should be to reject the null hypothesis (i.e. the tail beyond the critical value is smaller).
Charles
Hi Charles,
Thank you for your website. Could you confirm that the criteria for rejection is Wobs < Walpha (opposite direction of some other decision variables, such as F).
I guess this is so, because the square of the sums (b^2, numerator) increases slower than the sums of the squares (SS, denominator).
Thank you for your response.
Hello Martin,
You should use Table 2 to calculate the p-value. If p-value < alpha (usually alpha = .05), then reject the hypothesis of normality. See the following webpage for more details: https://real-statistics.com/tests-normality-and-symmetry/statistical-tests-normality-symmetry/shapiro-wilk-test/
Charles
Dear Dr. Zaiontz,
am I right by assuming the Shapiro-Wilk-Tables presented on this page are only applicable for Tests within a Significance Level of 5 %?
Thank you for providing this knowlege and also for this great webside.
Best regards
Max
Table 1 is applicable for any significance level. Table 2 is applicable for .01, .02, .05, etc. significance levels.
Charles
I really need to know the reference of this table. Thank you
Annisa,
The reference is the original paper by Shapiro, S.S. & Wilk, M.B. (1965). See Bibliography for details.
Charles
hi,
i need the values for n=60 and n=100. but i can´t find them nowhere. and p-values,of course. can you help me? unfortunately my knowledge of math isn´t that good.
thanks.
anna
Ann,
I don’t know of a table with such high values of n. For values of n larger than 50, you could use the Real Statistics SWPROB function (or better yet the SWTEST function) instead of statistics table. See the following webpage
Shapiro-Wilk Test
Charles
You can download the Sisvar software, it gives you all values you need.
Hello sir
How to calculate ai values by manual? I tried to calculate the covariance but could not. please help me
See the webpage
Shapiro-Wilk Expanded Version
Charles
Hi, is it possible to know how do you get the p-values table??????? Very curious! Thanks!
If I remember correctly, I believe I got it from the original Shapiro-Wilk paper. See the Bibliography for details.
Charles
Thanks for the great instructions! However, my results in SPSS and other stats tools yield different p-values (W value is the same) than this example. The first example gives a p-value of 0.873, but SPSS and other tools gives the p-value of 0.922. Is there a reason for this difference?
The website gives two ways of calculating the p-value for the Shapiro-Wilk test. The original method gives a p-value of .873 based on a linear interpolation, while the Royston method gives a value of .922, which is the same as that provided by SPSS.
Charles
Hello Dr. Zaiontz,
Thank you, this really helped!
I would like to ask, what if your W value is lower and out of the table? Example: n=20, computed W=0.8222. I looked at the table and the value at p=0.01 is 0.868
What should I do to find the p-value?
Thank you.
Johanna,
From the table all that you can conclude is that p < .01. In the next release of the Real Statistics Resource Pack you will be able to use the Royston approximation to compute a more exact value, which in this case will be .001888. I hope to have the next release out this week, hopefully tomorrow if I have time enough to complete all the testing. Charles
Hi Charles,
I just started to study statistics and I am trying to calculate Shapiro-Wilk (W) by myself. For this task I need to find the coefficient table 1 for n= 78 from a1 untill a35. Could you help me? Thank you
Raphaela
Raphaela,
The table I have stops at n = 50. For values n > 50 you can use the Royston approach to Shapiro-Wilk, as described on the webpage https://real-statistics.com/tests-normality-and-symmetry/statistical-tests-normality-symmetry/shapiro-wilk-expanded-test/. You can also use the following function provided by the Real Statistics Resource Pack: SWCoeff(n, j) = the jth coefficient for samples of size n.
Charles
Hi Dr. Zaiontz,
Thank you so much for creating this website! It’s very helpful!
I wonder how we can generate the p values using the W score and other results from Shapiro-Wilk without looking up this table?
Best,
Amelia
Hi Amelia,
You can do this using the Real Statistics software pack. Please see the webpage https://real-statistics.com/tests-normality-and-symmetry/statistical-tests-normality-symmetry/shapiro-wilk-expanded-test/ for how to do this.
Charles