Data Analysis Tool
Real Statistics Data Analysis Tool: The Real Statistics Cochrane-Orcutt Regression data analysis tool can be used to perform Cochrane-Orcutt regression to correct for autocorrelation.
To do this for Example 1 of Cochrane-Orcutt Regression (whose data is repeated on the left side of Figure 2), press Ctrl-m and select the Cochrane-Orcutt Regression option from the Reg tab (or from the Regression option when using the original user interface). Now fill in the dialog box that appears as shown in Figure 1.
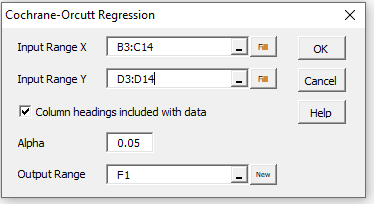
Figure 1 – Cochrane-Orcutt Regression dialog box
Results
Upon clicking on the OK button the output shown in Figures 2 and 3 appears. Note that cell G3 in Figure 2 contains the formula =CO_RHO(B4:C14,D4:D14).
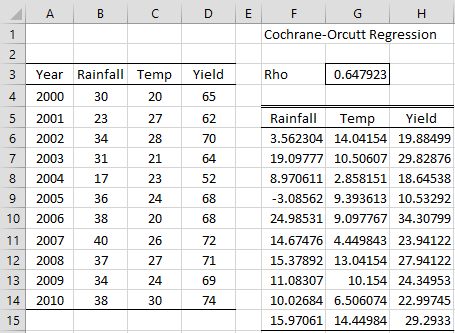
Figure 2 – Cochrane-Orcutt Regression results (part 1)
Note too that the regression analysis shown in Figure 3 consists of the OLS regression output whose coefficients and corresponding standard errors (range K17:L19) have been modified using the array formula =COCoeff(B4:C14,D4:D14,G3).
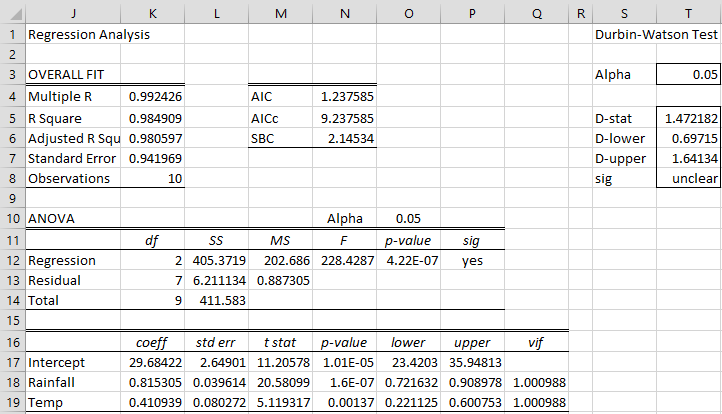
Figure 3 – Cochrane-Orcutt Regression results (part 2)
Examples Workbook
Click here to download the Excel workbook with the examples described on this webpage.
References
Wikipedia (2018) Cochrane-Orcutt estimation
https://en.wikipedia.org/wiki/Cochrane%E2%80%93Orcutt_estimation
Stata (2018) Prais–Winsten and Cochrane–Orcutt regression
https://www.stata.com/manuals/tsprais.pdf
NCSS (2025) Multiple regression with serial correlation
https://www.ncss.com/wp-content/themes/ncss/pdf/Procedures/NCSS/Multiple_Regression_with_Serial_Correlation.pdf
Hello Charles,
Great tools. Congratulations
I am trying to use the C-O regression with one input (X1)-one output (y), and 21 samples.
I apply the formulae:
CO_RHO(W4:W25;X4:X25)
But I get always as output = VALUE!
Hello Alejandro,
What do you see when you enter the formula =VER() in ant cell?
If you email an Excel file with your data, I will try to figure out what is going wrong.
Charles