Basic Concepts
The objective of the Bradley-Terry model is to determine the ranking of n variables, representing competitors, based on pairwise competitions.
Let 1, 2, …., n represent the competitors. Let wij = the number of matches in which i wins against j. We assume there are no ties. We also define wi = the number of wins by i.
![]()
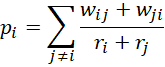
Our objective is to obtain a ranking ri such that ri > rj implies that i is a stronger competitor than j. In fact, we seek r such that
![]()
The likelihood function is
![]()
Thus, the log-likelihood function is
![]()
Maximizing LL
It turns out that we can obtain estimates for the ri that maximize LL via iteration. If the ri are the current estimates, then revised estimates are obtained via
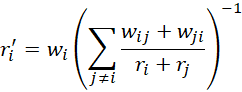
We then normalize these estimates via
and use these values as ri to obtain the next estimate.
Example
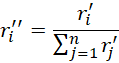
Example 1: Figure 1 displays the wins of 4 video game players in head-to-head competitions. E.g. players B and C play 11 games, of which B wins 6 times (w23 = 6) and C wins 5 times (w32 = 5). Player A won 5 games (w1 = SUM(B2:E2) = 5) in total and lost 0+3+2+4 = 9 times.
Determine the ranking ri of the 4 players.
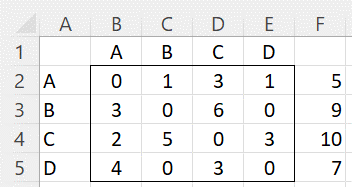
Figure 1 – Win table
Based on the sample in Figure 1, the probability of player i wins against player j is shown in Figure 2.
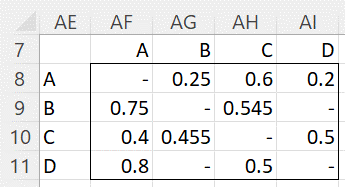
Figure 2 – Pairwise (sample) probabilities
E.g. since A beat B 1 time and lost 3 times, the probability that A beats B is 1/(1+3) = .25 (cell AG8). From Figure 1, we see that B and D never played each other and so the values in cells AI9 and AG11 are undefined.
Iterative Rankings
We need to estimate the rankings of the 4 players. We will do this so that the sum of the rankings is one. As described above, we create these ranking estimates iteratively, as shown in Figure 3 (using 17 iterations, stopping when the value in row 16 is equal to one.
We initialize the process by setting the ranks of each player to 1/n (1/4 = .25 for Example 1, as shown in M2:M5 of Figure 3).
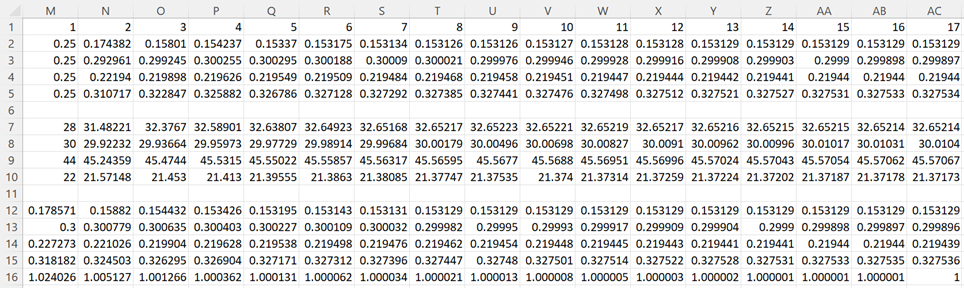
Figure 3 – Iterations
To create the iteration in Figure 3, we use the symmetric table of wij + wji values shown in Figure 4.
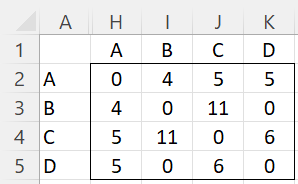
Figure 4 – Total pairwise matches
E.g. the value in cell J3 (or I4) is calculated by the formula =D3+C4.
We now show how to calculate the values in the range M7:M10, namely
E.g. we place the formula
=$H2/(M2+M$2)+$I2/(M2+M$3)+$J2/(M2+M$4)+$K2/(M2+M$5)
in cell M7, highlight M7:M10, and press Ctrl-D.
The values in range M12:M15 correspond to the ri′ = wi/pi. This is done by inserting the formula =$F2/M7 in cell M12, highlighting M12:M15, and then pressing Ctrl-D. We also calculate the sum of the ri′ in cell M16 via the formula =SUM(M12:M15), Finally, we normalize the ri′ as the next iteration of the ranks as shown in N2:N5. This is done by inserting the formula =M12/M$16 in cell N2, highlighting range N2:N5, and pressing Ctrl-D.
We now complete the rest of the calculations for iteration #2 by highlighting the range M7:N15 and pressing Ctrl-R. Finally, we fill in the rest of Figure 3 (iterations 3-17) by highlighting range N2:AC16 and pressing Ctrl-R. We highlight enough columns so that the value in row 16 becomes 1.
We see from range AC2:AC5 that the rankings for the 4 players are (.153, .300, .219, .328). Thus D is viewed as the strongest player, while A is the weakest. Notice that the order is not the same as the values in column F.
Pairwise Rankings
The pairwise ranking of the 4 players is shown in Figure 5.
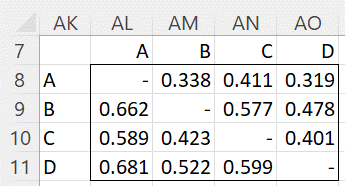
Figure 5 – Pairwise (population) probabilities
For example, the value in cell AO9 is calculated via the formula =AC3/(AC3+AC5). This means that the probability that B beats D in any match is 47.8% (and the probability that D wins is 1-.478 = 52.2% as shown in cell AM11). Note that we are able to obtain such probabilities despite the fact that B and D never played each other.
Worksheet Functions
Real Statistics Functions: The Real Statistics Resource Pack provides the following array functions where R1 is a square array of the results of head-to-head matches (as B2:E5 of Figure 1) and R2 is a column array with the rankings of the competitors (as AC2:AC5 of Figure 3).
BT_MODEL(R1, prec, iter): returns a column array with the rankings of the competitors whose pairwise wins are shown in R1. A maximum of iter iterations is performed (default 100), although the iterations stop when the sum of the ranks (before normalization) is less than or equal to 1+prec (prec defaults to .0000001).
PairwiseRanks(R1): returns a square array with the pairwise probabilities based on the sample in R1 (as shown in Figure 2).
PairwiseRanks(R2): returns a square array with the pairwise probabilities based on the population rankings in R2 (as shown in Figure 5).
We see that =BT_MODEL(B2:E5) produces results similar to those shown in range AC2:AC5 of Figure 3. =PairwiseRanks(B2:E5) produces the results shown in range AF8:AI11 of Figure 2 and =PairwiseRanks(AC2:AC5) produces the results shown in range AL8:AO11 of Figure 5.
In fact, we can obtain the results shown in Figure 5 via the array formula =PairwiseRanks(BT_MODEL(B2:E5)).
Examples Workbook
Click here to download the Excel workbook with the examples described on this webpage.
Links
References
Wikipedia (2023) Bradley-Terry model
https://en.wikipedia.org/wiki/Bradley%E2%80%93Terry_model
Fleischhaker, D. D. (2019) Modelling outcomes in Canadian professional football via generalized Bradley-Terry models
https://www.semanticscholar.org/paper/Modelling-Outcomes-in-Canadian-Professional-via-Fleischhaker/e778edff4806655492e1d46b1628fa844e23eb71/figure/0
1 thought on “Bradley–Terry Model”