Objective
Like Bland-Altman or Deming Regression, Lin’s Concordance Correlation Coefficient (CCC) is a method for comparing two measurements of the same variable. This is especially important if you are trying to introduce a new measurement capability that has some advantages (e.g. it is less expensive or safer to use) over an existing measurement technique (the “gold standard”).
Definition and Interpretation
Lin’s CCC between two random variables x and y is defined as
![]()
where ρ is the correlation coefficient between variables x and y. Lin’s CCC is equivalent to 1 minus the ratio of the expected orthogonal squared distance from the line y = x and the expected orthogonal squared distance from the line y = x, assuming independence.
The sample version of Lin’s CCC is
![]()
Here, we use the population versions of sx and sy, in that we divide by n instead of by n–1. The calculation is reasonably accurate for n ≥ 10.
Like a correlation coefficient, -1 ≤ ρC ≤ 1 and -1 ≤ rC ≤ 1 .
Values near +1 indicate strong concordance between x and y, values near -1 indicate strong discordance, and values near zero indicate no concordance. There is no clear-cut agreement as to how to interpret other values, although one approach is to interpret Lin’s CCC as for Pearson’s correlation coefficient (e.g. values less than .20 are poor, while values greater than .80 are excellent).
McBride recommends much more stringent requirements (less than .90 is poor, .90-.95 moderate, .95-.99 substantial, and greater than .99 is excellent).
Confidence Interval
To calculate a confidence interval, first, apply the Fisher transform to Lin’s CCC to get r′C and then use the following standard error for the transformed value.
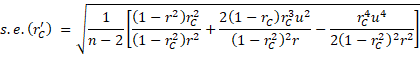 where
where![]()
The confidence interval for the transformed value of ρC is then
![]()
Taking the inverse Fisher transform yields the desired confidence interval for ρC.
Example
Example 1: Calculate Lin’s CCC for the data in range A3:B21 of Figure 1 as well as the 95% confidence interval.
The Excel calculations are shown in columns E and F of Figure 1, and column H shows the formulas in column E. Lin’s CCC is .9359, and the 95% confidence interval is (.8438, .9745).
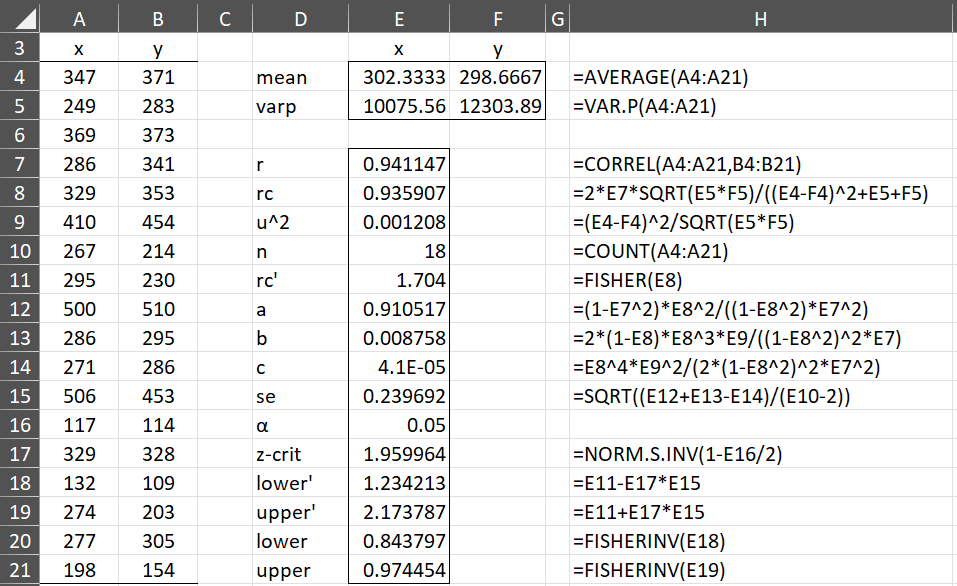
Figure 1 – Lin’s Concordance Correlation Coefficient
We see from Figure 2 that the data (shown in blue) aligns pretty well along the diagonal line y = x (shown in red).
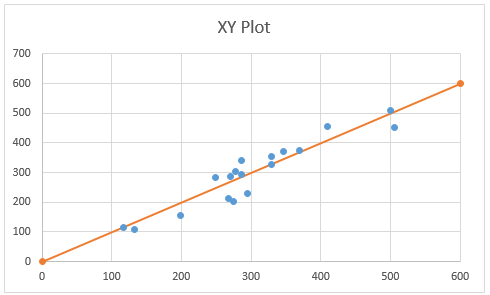
Figure 2 – Chart of the data
Worksheet Function
Real Statistics Function: The Real Statistics Resource Pack contains the following array function:
LINCCC(R1, R2, lab, alpha): returns a column array with the values Lin’s concordance correlation coefficient plus the lower and upper ends of the 1–alpha confidence interval; alpha is the significance level (default .05); if lab = TRUE, then a column of labels is added to the output (default FALSE).
The formula =LINCCC(A4:A21,B4:B21,TRUE) produces the output for Example 1, as shown in Figure 3.
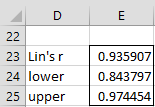
Figure 3 – Output from LINCCC
Examples Workbook
Click here to download the Excel workbook with the examples described on this webpage.
Links
References
Steichen, T. J. and Cox, N. J. (2002) A note on the concordance correlation coefficient. The Stata Journal.
https://journals.sagepub.com/doi/pdf/10.1177/1536867X0200200206
McBride, G. B. (2005) A proposal for strength-of-agreement criteria for Lin’s concordance correlation
https://www.medcalc.org/download/pdf/McBride2005.pdf
NCSS (2019) Lin’s concordance correlation coefficient
https://www.ncss.com/wp-content/themes/ncss/pdf/Procedures/PASS/Lins_Concordance_Correlation_Coefficient.pdf
Thank you for sharing, Carlos Zaiontz.
I noticed that the confidence interval was calculated using the Z critical value. In cases of small sample sizes — for example, n < 30 — wouldn't it be more appropriate to use the t critical value instead?
I'd be interested to hear your opinion on the choice of this coverage factor for computing the confidence interval.
Hello Alan,
It does seem to make sense to use t-crit instead of z-crit, but in all the papers I have read z-crit is used instead.
Charles
Gracias por la info!. Sabrias como se calcula el tamaño de muestra para este estudio?
saludos
Marcela
Hello Marcela,
Here are some articles on this subject>
https://genstat.kb.vsni.co.uk/knowledge-base/slins-concordance/
https://www.ncss.com/wp-content/themes/ncss/pdf/Procedures/PASS/Lins_Concordance_Correlation_Coefficient.pdf
https://www.researchgate.net/publication/266974873_A_Simple_Approach_for_Sample_Size_Calculation_for_Comparing_Two_Concordance_Correlation_Coefficients_Estimated_on_the_Same_Subjects
Charles
Thank you so much !!!!!! 🙂
Thanks – this is a great resource!
Thanks very much for this resource – it’s amazing
I was wanting to use Lin’s coefficient bu I can’t find it anywhere in the menu – am I missing something obvious? It’s not in inter-rater reliability
Hi Richard,
Thanks for your kind remarks.
Lin’s coefficient is not on the menu. To get Lin’s coefficient, you need to use the LINCCC worksheet function.
Charles
Hola Richard
estoy usando el coeficiente de Lin con la función de la hoja de trabajo LINCCC, pero solo me sale Lin’s r
sin ningún valor numerico ¿quizá no estoy tomando en cuenta algo?
Hello Yulisa,
This is an array function, and so to see all the output, you can’t simply press the Enter key. See
https://real-statistics.com/excel-environment/array-formulas-functions/
for how to see all the output.
Charles
Hello Dear Charles,
First of all, I’d like to thank you very much for the work you’ve done to provide us with suitable, comprehensible support for producing statistics using Excel.
I have a question about the calculation of Lin’s concordance coefficient: in your example, in figure 1, “VAR.P” is calculated from values A4 to A20, excluding A21. Is this correct or is there an error in the calculation?
Thanks again for your help.
R. Van Cauter
Hello Ralph,
The actual formula that was used is VAR.P(A4:A21). The formula was mislabeled. I have now changed this on the webpage as well as in the attached Excel workbook.
Thank you very much for catching this error.
Charles
Note that this Excel workbook uses the VAR.P function for population variance, even though it is a sample-based estimate of the population variance (for which one would use (N-1) in the denominator, if not using library functions).
There appears to be some difference of opinion here, noted on Wikipedia with Nickerson’s 1997 paper (A Note On “A Concordance Correlation Coefficient to Evaluate Reproducibility”) instead using sample estimators as intuition would suggest.
Can you justify your use of population variance (VAR.P) over sample variance for the sample?
Hello Neumann,
I don’t recall why I chose to use the population version of the variance. I probably saw that this is what was used by some other software tool or an example in some book or article.
Charles