Real Statistics Data Analysis Tool: The Real Statistics Resource Pack provides a data analysis tool called T Tests and Non-parametric Equivalents, which combines the analyses for equal and unequal variances, as well as providing confidence intervals and Cohen’s effect size. A second measure of effect size, based on the correlation coefficient r is also provided, as described in Dichotomous Variables and the t-test.
Example
Example 1: Repeat Example 2 of Two-sample T-test with Unequal Variances using the Real Statistics data analysis tool.
Press Ctrl-m and select T Tests and Non-parametric Equivalents from the Misc tab (or from the main menu if using the original user interface). Now, fill in the dialog box that appears as shown in Figure 1.
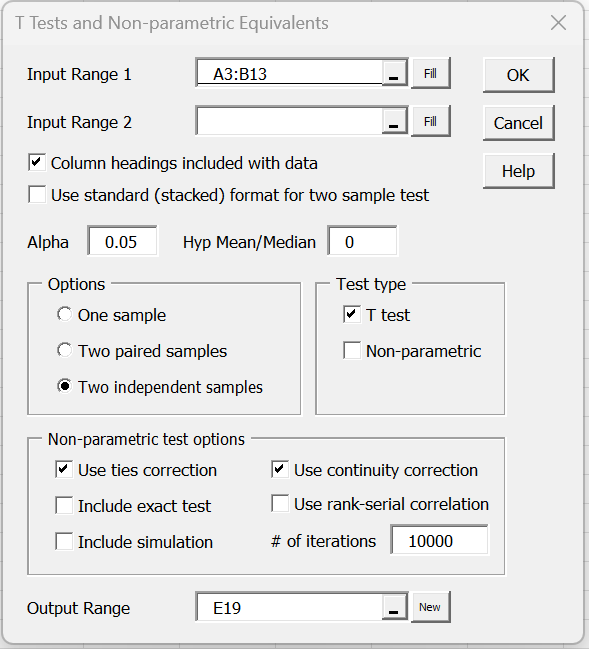
Figure 1 – Dialog box for t-test
If the two samples consist of two contiguous columns, then the combined range can be inserted into the Input Range 1 field, as shown in Figure 1. Otherwise, the ranges of the two samples should be inserted separately in the Input Range 1 and Input Range 2 fields.
When you press the OK button, the output shown in Figure 2 is displayed.

Figure 2 – Real Statistics data analysis
You can see from Figure 2 that the degrees of freedom have been reduced from 18 to 11.208 under the assumption of unequal variances. We can get this same value by using the formula =DF_POOLED(A4:A13, B4:B13).
Observations
The input data for the two independent sample t-test can have missing data, indicated by empty cells or cells with non-numeric data. Such cells will be ignored in the analysis.
Notice that the df reported by Excel’s t-Test: Two-Sample Assuming Unequal Variances data analysis tool is rounded off to the nearest integer (see Two-sample T-test with Unequal Variances), while the df reported by the Real Statistics data analysis is not rounded off.
Data in standard format
In Example 1, the input data consisted of two columns, one for each sample. The T Test and Non-parametric Equivalents data analysis tool can also be used with data in standard (stacked) format.
Example 2: Conduct the two independent sample t-test for the data in standard format as shown in range A3:B15 of Figure 3.
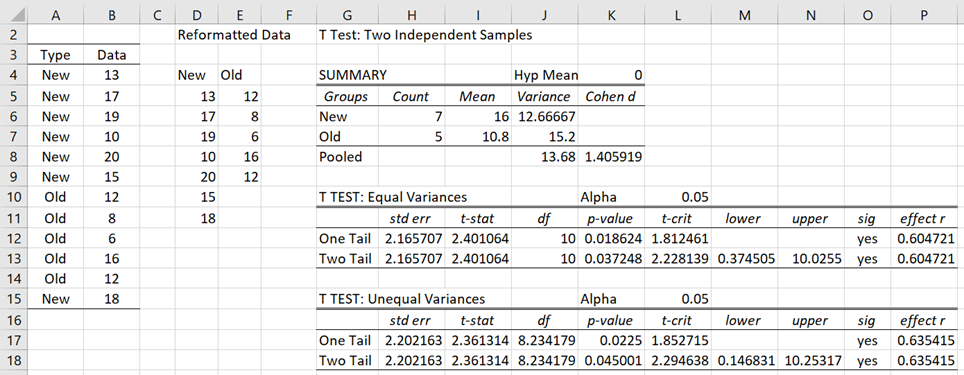
Figure 3 – t-test for data in standard format
You can use the T Test and Non-parametric Equivalents data analysis tool to accomplish this as described for Example 1, except that when the dialog box appears, as shown in Figure 1, you need to uncheck the Column headings included with data field and select the Use standard (stacked) format for two sample test field. The Input Range 1 field should be filled in with A4:B15. The results of the test are shown on the right side of Figure 3. Note that columns D and E display the input data from columns A and B in non-standard format.
Examples Workbook
Click here to download the Excel workbook with the examples described on this webpage.
Reference
Howell, D. C. (2010) Statistical methods for psychology (7th ed.). Wadsworth, Cengage Learning.
https://labs.la.utexas.edu/gilden/files/2016/05/Statistics-Text.pdf