On this webpage, we show how to test whether specific data fits a particular pattern or distribution using a chi-square goodness-of-fit test.
Basic Concepts
Suppose the random variable x has binomial distribution B(n, p), and define z as
![]()
By Corollary 1 of Relationship between Binomial and Normal Distributions, provided n is large enough, generally, when np ≥ 5 and n(1–p) ≥ 5, then z is approximately normally distributed with mean 0 and standard deviation 1.
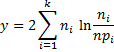
Thus by Corollary 1 of Chi-square Distribution, z2 ~ χ2(1), where
 Introductory example
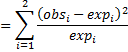
Example 1: Suppose we flip a coin 10 times and obtain 9 heads and 1 tail. Is the coin fair?
We have already studied problems like this in Binomial Distribution and Hypothesis Testing using the Binomial Distribution. We can even use the normal approximation of the binomial distribution to solve such problems. This time we will use the chi-square distribution.
Let x be the random variable that counts the number of heads in n trials and define the null hypothesis as follows:
H0: the coin is fair, i.e. p = .5
Since np = 10 ∙ .5 = 5 ≥ 5 and n(1–p) = 10 ∙ .5 = 5 ≥ 5, we can apply the chi-square distribution as described above.
![]()
Now p-value = CHISQ.DIST.RT(6.4, 1) = 0.011412 < .05 = α, and so we reject the null hypothesis and conclude with 95% confidence that the coin is not fair. This analysis is summarized in Figure 1.
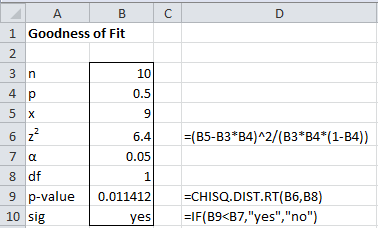
Figure 1 – Chi-square test
Note that the “two-tailed” hypothesis is tested by a one-tailed chi-square test.
Goodness-of-fit for two outcomes
Let obs1 = the number of observed successes and obs2 = the number of observed failures in n trials. Furthermore, let exp1 = number of expected successes and exp2= number of expected failures in n trials. Using the terminology of Example 1, this means that obs1 = x, obs2 = n – x, exp1 = np and exp2= n(1–p).
By algebra, z2 can be expressed as
![]()
As we have observed above, z2 ~ χ2(1). This observation amounts to what is known as the chi-square goodness of fit test for two mutually exclusive outcomes. We now look at the situation for more than two outcomes.
Goodness-of-fit test (Maximum Likelihood version)
Suppose we have an experiment consisting of n independent trials, each with k mutually exclusive outcomes Ei, such that for each trial the probability of outcome Ei is pi. Suppose further that for each i the observed number of occurrences of outcome Ei is ni. These are the conditions for the multinomial distribution.
Our objective is to determine whether the observed frequencies n1, …, nk are consistent with the expected outcomes based on the multinomial distribution, namely np1 ,…, npk.
This problem is equivalent to determining whether to accept the following null hypothesis:
H0: pi = ni/n for all i = 1, …, k
For small samples, the problem can be solved using Fisher’s Exact Test, but for larger samples, this becomes computationally difficult. Instead, we use the maximum likelihood ratio λ, as described in Maximum Likelihood Function. The idea behind this approach is to create a model for which the probability of obtaining the observed data is maximized, and then compare this model with the probability of obtaining the observed data under the null hypothesis.
We now use a theorem from advanced theoretical statistics that under certain conditions the random variable -2 ln λ, where λ is as defined in Definition 2 of Maximum Likelihood Function, has a distribution that approaches χ2 (k) as n → ∞ where n = sample size and k = the number of parameters determined by the null hypothesis.
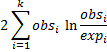
For a multinomial distribution, the random variable -2 ln λ can be expressed as
Here the ni are the observed values and the npi are the expected values (based on the multinomial distribution). Since
![]()
the null hypothesis H0 references only k–1 parameters, and so by this theorem from advanced theoretical statistics, y ~ χ2 (k–1) for sufficiently large n.
We summarize the above observations in Property 1 using the following alternative way of expressing the random variable y.
Definition 1: The maximum likelihood statistic (for the multinomial distribution) can be expressed as:
Property 1: For sufficiently large values of n, the maximum likelihood test statistic has approximately a chi-square distribution with k – 1 degrees of freedom, i.e. χ2 (k–1).
Goodness-of-fit test (Pearson’s version)
Definition 2: Pearson’s chi-square test statistic, is defined as:
Usually, the maximum likelihood test statistic is not used directly. Instead, a further approximation, Pearson’s chi-square test statistic, is commonly used. For large samples the results are similar, but for small samples, the maximum likelihood statistic yields better results. In the case where k = 2, Pearson’s chi-square test statistic is the z2 statistic we looked at earlier on this webpage.
Property 2: For sufficiently large values of n, Pearson’s chi-square test statistic has approximately a chi-square distribution with k–1 degrees of freedom, i.e. χ2 (k–1).
Property 2 is used to perform what is called goodness of fit testing, where we check to see whether the observed data correspond sufficiently well to the expected values.
Assumptions
In order to apply such tests, the following assumptions must be met (otherwise the chi-square approximation in Property 2 may not be accurate).
- Random sample: Data must come from a random sampling of a population.
- Independence: The observations must be independent of each other. This means that the chi-square test cannot be used to test correlated data.
- Cell size: k ≥ 5 and the expected frequencies expi ≥ 5. When k < 5 it is better to have even larger values for the expi. These assumptions are similar to those for the normal approximation of the binomial distribution.
If the expected frequency for one or more cells is less than 5, it may be beneficial to combine one or more contiguous cells so that this condition can be met (although this must be done in such a way as to not bias the results).
For large values of k, a small percentage of cells with an expected frequency of less than 5 can be acceptable. In any event, no cell should have an expected frequency of less than 1.
Basic Example
Example 2: We have a die that we suspect is loaded to favor one or more numbers over the others. To test this we throw the die 60 times and get the following counts for each of the 6 possible throws shown in the upper part of the worksheet in Figure 2.

Figure 2 – Data for Example 2
Essentially we are testing the following hypothesis about the multinomial distribution:
H0: the probability of throwing any of the six faces on the die is 1/6.
We calculate the chi-square test statistic to be 12.4 (using the formula =SUM(B7:G7) in cell H7 of Figure 2). Here cell B7 contains the formula =(B4-B5)^2/B5 (and similarly for the other cells in range B7:G7). We now apply the chi-square test with k = 6 (and so df = 5) as follows:
p-value = CHISQ.DIST.RT(χ2, df) = CHISQ.DIST.RT(12.4,5) = .0297 < .05 = α
Since p-value < α, we reject the null hypothesis and conclude (with 95% confidence) that the die is biased. We can reach the same conclusion by looking at the critical value of the test statistic:
χ2-crit = CHISQ.INV.RT(α, df) = CHISQ.INV.RT(.05,5) = 11.07 < 12.4 = χ2-obs
Worksheet Function
Excel Function: Excel provides the following function which automates the above calculations:
CHISQ.TEST(R1, R2) = CHISQ.DIST.RT(χ2, df) where R1 = the array of observed data, R2 = the array of expected values, χ2 is calculated from R1 and R2 as in Definition 2, and df = the number of elements in R1 (or R2) minus 1.
R1 and R2 must both have either one row or one column, they must contain the same number of elements, and all the cells in R1 and R2 must contain only numeric values.
Versions of Excel prior to Excel 2010 don’t support CHISQ.TEST. The equivalent function CHITEST is used instead.
For Example 2 we can calculate p-value = CHISQ.TEST(B4:G4,B5:G5) = .0297.
Another Basic Example
Example 3: A safari park in Africa is divided into 8 zones, each containing a known population of elephants. A sample is taken of the number of elephants found in each zone to determine whether the distribution of elephants is significantly different from what would be expected based on the known population in each zone. The table on the left of Figure 3 (columns A-C) summarizes the data:

Figure 3 – Data for Example 3
The sample consists of the 55 elephants actually recorded (obsi by zone). If we scale the known population of 205 elephants down to 55 (by multiplying the population in each zone by 55/205) we arrive at the expected number of elephants (expi) in each zone (column E). For the analysis, we use the following null hypothesis:
H0: there is no significant difference between the distribution of the sample and the population distribution
We now calculate the p-value = CHISQ.TEST(B4:B11, E4:E11) = 0.82.
Since p-value = .82 > .05 = α, we don’t reject the null hypothesis and conclude there is no significant difference between the distribution of elephants in the sample among the zones compared with the known population.
Fitting data to a distribution
The chi-square goodness of fit test can be applied to determine whether observed data fit a certain distribution (or curve). If all the parameters of the distribution are known, then the approach is exactly as described above.
If one or more of the distribution’s parameters is not known and so must be estimated from the data, then a modified version of the goodness-of-fit test is required. See Goodness-of-Fit to a Distribution for details.
Examples Workbook
Click here to download the Excel workbook with the examples described on this webpage.
References
Zar, J. H. (2010) Biostatistical analysis 5th Ed. Pearson
https://bayesmath.com/wp-content/uploads/2021/05/Jerrold-H.-Zar-Biostatistical-Analysis-5th-Edition-Prentice-Hall-2009.pdf
Agresti, A. (2013) Categorical data analysis, 3rd Ed. Wiley.
https://mybiostats.files.wordpress.com/2015/03/3rd-ed-alan_agresti_categorical_data_analysis.pdf
Howell, D. C. (2010) Statistical methods for psychology (7th ed.). Wadsworth, Cengage Learning.
https://labs.la.utexas.edu/gilden/files/2016/05/Statistics-Text.pdf
Hello charles thanks for the reply and one more thing am doing a survival analysis and using the stata software for analysis am having problems with the command to do the model fitness test , can i use chi square test for this cox proportional model and if i can can u help me with the command ?
Thank in advance
Hello Megdi,
Sorry, but I am not familiar with stata and so I don’t know how to use this command.
Charles
Is there any sample data or example we can use to test if lottery numbers drawn (5/56) were biased or not? Thanks in advance.
You can use the binomial distribution to make this kind of test. See the following webpage:
https://www.real-statistics.com/binomial-and-related-distributions/hypothesis-testing-binomial-distribution/
Charles
Hello Charles,
I would like to understand if the Goodness of Fit and Chi-Square distribution properties you described in this page can be used also for the following purpose:
I wish to compare the following two tables:
MALES
FPI SPI GPI
GOOD 17 10 14
POOR 0 4 0
NEUTRAL 15 18 18
FEMALES
FPI SPI GPI
GOOD 30 12 17
POOR 0 3 0
NEUTRAL 18 33 21
where FPI, SPI, GPI are 3 indexes, that can have outcomes GOOD, POOR or NEUTRAL for each sample of the two populations (32 males, 48 females). My goal is to check if the outcomes of males and females group are significantly different.
The chi-square distribution can be applied in this case?
A further problem is that I can have zeroes in some cell of the table, like in this example.
Thank you very much for your help
Best Regards
Piero
Piero,
If you had two 2×2 contingency tables you could use the Cochran-Mantel-Haenszel test (based on the odds ratio).
https://www.real-statistics.com/chi-square-and-f-distributions/cochran-mantel-haenszel/
Sorry, but I don’t know how to test two 3×3 contingency tables nor what metric you would use to make the comparison.
Charles
Hello Charles,
thank you very much for your suggestion.
In effect, my 3 indexes FPI, SPI and GPI are not strictly related among themselves, or at least I’m not interested in their relationship.
So I could split into 3 tests, that is: are FPI for males (good=17, poor=0, neutral=15), different from females (good=30, poor=0, neutral=18)?
And so on for the SPI and GPI.
In this case, what is better to use, considering that some values could be zero like in my example?
Thank you very much
Best Regards
Piero
Piero,
If you now have two 2×2 contingency tables, then you can use the test that I suggested in my previous response. Since you plan to have 3 such tests, you need to use a familywise error correction, such as Bonferroni, as described at
https://www.real-statistics.com/hypothesis-testing/familywise-error/
Charles,
I realized I was not clear in my question.
What I want to do is to test if this two vectors of 3 score values each:
(17, 0 , 15)
and
(30, 0, 18)
are statistically different or not.
The problem is that one or more of the vector values can be zero, like in my numerical example.
So I don’t know if it is possible to do such a test.
Thank you
Piero
Piero,
Can the two zero entries also take non-zero values? Can one of the four non-zero values also be zero?
Charles
Charles,
>> Can the two zero entries also take non-zero values?
Yes it is possible.
>>Can one of the four non-zero values also be zero?
This is possible too.
Zero could occur at any position, or it could not occur at all.
Thank you again
Piero
Dear Charles,
I realized I made a big mistake in my original question!
In fact, FPI, SPI and GPI are three different dependent variables, each of which, for each subject in the sample, can assume one of the 3 mutually exclusive outcomes: Good, Poor or Neutral.
So, the data I wrote in my post is not contingency tables!
Can I send you some Excel data so that I can better explain my problem?
Thank you very much and sorry for my confusion
Best Regards
Piero
Piero,
Yes, you can email me an Excel file with data, but I also need a clear explanation of what you are trying to accomplish.
Charles
Perhaps you can use ordinal regression.
Charles
Hello Charles,
I prepare the data and send you en email with all the explanations, thank you very much!
Piero
Charles,
I want to find the best fit for a model curve to data. The model has two adjustable parameters and it seems that finding the minimum the Chi-square statistic would the fairest way to minimize the difference between observed and modeled values. I would appreciate knowing of a better way. Thanks.
Dave,
When you use the Maximum Likelihood Estimation approach to fitting data to a distribution, you should calculate the AIC statistic for each distribution and pick the one that is the smallest. If you only consider two-parameter distributions, then this is equivalent to picking the distribution with the smallest log-likelihood value.
I am not sure what the best approach when using the chi-square test for goodness of fit. Assuming that you are considering only two-parameter distribution, the distribution with the largest chi-square statistic (assuming the right-tailed CHISQ.DIST.RT) does seem to be best, but I have not found confirmation of this approach.
Charles
Hi Charles
I am wondering how the statement below is related to your formula on rejecting the null hypothesis (IF(E6<=0.05,"yes","no).
If R Rc,a , depending on whether R is less than or greater
than 1, then the Poisson hypothesis is rejected.
Reference: https://journals.ametsoc.org/doi/full/10.1175/1520-0442(1998)011%3C0848%3AATTMTI%3E2.0.CO%3B2
Thank you.
Cumulus,
Thanks for sending me a reference to this article. What does R Rc,a mean?
Charles
Hi Charles,
R is the variance to mean ratio. It is being compared to critical R (Rc) which is obtained from X ^2 /[N-1].
Thank you.
Hi Charles. Thanks for your help. I used the Chi-square test to determine if smiling versus a neutral expression is associated with others smiling. I used a 2×2 table. This is for my daughter’s science fair project. The Pearson Chi-square value was 26.50 at one degree of freedom. Your Chi-square formula in Excel worked great. She also wrote down if each respondent was male or female and suspects females smile more often than males. I’m wondering if she should also use a Chi-square test to test this out or if a different test would work better?
Chris,
It depends on the nature of your data, but since you were successful using the Chi-square test for independence for the first test, it seems like the chi-square test for independence should work well for this second test.
Charles
why are you using goodness of fit,
pls reply
You use goodness of fit techniques to determine whether some data corresponds to a particular distribution.
Charles
Hi Charles,
Thanks for the useful information. I am trying to test the goodness of fit of my model (with classified data) using Chi-squared. Since my sample size it very large (around 100,000) I keep getting large Chi-squared values which results in rejecting the hypothesis. To my understanding, it looks like that Chi-squared is sensitive to the sample size such that with even a small difference between the observed and expected values, it’s very likely that the Chi-squared is going to be large. Is there any way or other tests to deal with this issue?
Thanks.
Noemie,
Yes, with large samples it is more likely that you will find an effect. This is one of the reasons for not just testing for significance, but also measuring the effect size — to see whether the effect is small, medium, large, etc.
Charles
Charles,
I ran binary logist regression model, and, from the result, I saw that the formula in the cell of df (dree of freedom) for log liklihood test under the cell of Chi-sqaure is the count of variables rather than that of variables minus 1. Then this formula is refered to p-value (CHIDIST). Is there any reason for using the number of variables instead of numbder of variable minus 1 for degree of freedom? Thanks.
Maoren,
In the goodness of fit test, df = the sample size minus 1 (not the number of variables minus 1). In the logistic regression test, df = the number of variables. These are completely different tests.
Charles
Hi everyone, I have a set of 35 data points. I want to find the best fit distribution and its parameters. I searched all over the net and book no where it is very clearly mentioned. I have to use excel as I don’t have any software. Can any one help me with this. The data set is as follows. Kindly give clear steps I read that we have to do Ch2 ,KS,Anderson Darling three tests and see which is the best fit. but no clue how to do this.
my mail is asif1034@gmail.com
1.3
7.3
7.8
13.3
13.9
19.4
19.7
22.3
22.8
26.7
29.7
30.2
31.9
32.2
33
36.8
37
41.7
46.7
50.4
51.4
60
61.3
61.4
65.6
65.8
72.6
78.4
100.4
110.6
111.4
118.2
119.4
132.1
139.7
Asif,
The referenced webpage shows you, step by step, how to determine whether your data fits a Poisson distribution by using a chi-squared goodness of fit test. The approach is the same for all other distributions. I am afraid that you will need to to use trial and error to see which distributions are a fit and which are not.
You could graph the data (e.g. via a histogram) to see which distributions are likely.
There are a lot of tests to determine whether the normal distribution is a fit for the data. See the following webpage for lots of information about how to conduct such tests:
Tests for Normality
Charles
PROCEDURE TO CALCULATE EXPECTED FREQUENCY FOR GOODNESS OF FIT
For the life times of 11 air conditioning system of an air plane 33,47,55,56,104,176,182,220,239,246 and 320, I want to calculate Goodness of fit under Frechet distribution.
PROCEDURE:
1. Assume the parameter values
2. For eg: if shape parameter=1.5 and scale parameter=1, the expected frequency for t=33 is calculated by using the above said values to probability density function of frechet distribution. The answer is E.F =0.000239.
Is my procedure correct or else give me the manual calculation for chi-square goodness of fit. Please help me.
Malathi,
The approach that you are using seems correct, although I have not checked any of your values. Since you have assumed values for the two parameters, you won’t have any unknown parameters in calculating the goodness of fit.
Charles
Is this a valid test for determining whether a histogram of samples is from a normal distribution:
H0: Histogram is NOT from a normally distributed population
where the test_stat=The Pearson’s chi-square test statistic as before but now the critical value is a maximum threshold with any values lower than that threshold indicaing that the null hypothesis should be rejected. In that way, one could assert at a specific level of significance, when the test_stat is very small, that a histogram is from a normal distribution.
This is sort of the opposite approach. Can you explain why this would potentially be invalid?
Brian,
Sorry but I don’t understand what you are describing.
Charles
If I write the data in time series (demands series data)
Y_t Y_t-1 Y_t-2 … Y_t-23
SKU1 2 0 27 1
SKU2 56 73 24 13
SKU3 0 0 1 0
SKU4 2 1 1 0
.
.
.
SKU3000 15 10 3 7
I want to check the dispersion and will use the definition 4.
How to use the formula?
Sir, I want to ask my problem.
I have a data series. The data is from automotive industry consists of demand histories of 3000 SKUs over a period of 2 years (24 months).
I want to test the dispersion of poisson disribution in order to remove tha data series of highly variable demands.
So I have a data table of 3000×24.
So X_1 have 3000 data
X_2 has 3000 data
…
X_24 the same.
Am I right??
based on the definition 4, how can I calculate and check the dispersion??
Hopefully, I can get your reply soon.
regards, Kinzie
Kinzie,
Assuming that you have placed the 3000×24 data table in the range A1:X3000. You can place the dispersion for each column in range AA1:XX1. This can be done by placing the formula =VAR.S(A1:X3000)/AVERAGE(A1:X3000) and then highlighting the range AA1:XX1 and pressing Ctrl-R.
The closer these values are to 1 the more likely each of the columns contains data from a Poisson distribution.
I have not provided a statistical test for this since instead I have explained how to use the Chi-square Goodness of Fit approach for determining whether data fits a Poisson distribution.
Charles
Hi Charles
I was going through this thread as I a am facing a similar situation as Kinzie, I have 5000 SKUs with historical demand for last 3 years at monthly level. Some having intermittent demand. I have applied the Goodness of fit test by dividing into bins and then carrying out a Chi Square test. My series has a lot of zero values corresponding to each SKU and intermittent behavior is quite evident but my Goodness of fit test shows it as Normal distribution. Should there be some check on the number of non-zero values throughout the 36 month horizon?
Udit,
The goodness of fit test is not accurate when there are zero expectation values.
Generally it is better to use Shapiro-Wilk to test for normality than chi-square.
Charles
Wonderfull explanation of the theory.
Now I understand qhy some authors use expected vaules in the denominator and some error size.
Keep on writting!
i have a set of two gravity values obtained by two different methods. now i want to assess whether the two methods give reliable results. how do i do this?
It depends on what you mean by “reliable results”. If you mean that each set of gravity values fits values predicted by a theory of gravity, then you can perform the chi-square goodness of fit test twice, once for each set of values vs. the theoretical values.
Charles
Sir, what if I have certain set of data ex: 25, 35, 40, 50, 60, 35, 40, 70…
How can I know if this has a poisson distribution or not?
Thanks!
Jon,
Just follow the approach in Example 4 of the referenced webpage.
Charles
I think you are my hero. I have frequency data as follows:
n f
0 1215
10 0
20 0
30 3004
40 0
50 1833
60 496
70 135
80 86
90 191
100 18
110 11
120 0
130 4
Sum(f) = 6994, 7 card poker hands – Texas Hold-em
Mode = 30 points assigned to the completed hand
The point generating algorithm uses 9 probabilistic factors that mirror the odds of getting each type of hand(straight, 3 of kind, etc.)
I want to tune the model using solver to optimize the goodness of fit. Subtle changes in the factors will begin to fill in the missing pieces of the distribution providing more of a continuous evaluative function.
1) What would be your worksheet suggestion on the metric or the solver target variable that would necessarily improve the quality and predictability of the distribution?
2) Would we be better off, with regard to item 1, using the Pearson value from the regression between the pure theoretical odds and the 9 probabilistic factors employed? (Except, I don’t know how to get this non-linear R^2 into a worksheet formula.
Your knowledge is impressive and supported with wonderful examples. Any help you could lend me would be blessing.
staryman@att.net
I am trying to understand your data. What does n represent (10 = no pair, 20 = 1 pair, 30 = 2 pairs, etc.)? Which point generating algorithm are you referring to? (a trendline? a trendline on a pixel background? etc.). Is the goal to create a straight line which best approximates the raw data (in which case linear regression seems to be the right choice)? I need to understand the problem better.
Charles
Charles,
Thanks for the help.
I can see it by typing it into the cell. I had been looking for it by clicking on the Add-Ins macro button (“Real Statistics”). If one does this, you can’t see the Fit_Test. Anyway, I am no able to use it, so thanks again.
It is interesting though, as soon as a single interval is skipped and subsequently there is a “hit” for the next or one of the subsequent interval, the Poisson distribution does not fit. Is this what you would expect? So for example, in the example 4 above, if you have hits for interval 0, 1, 2,3 and 4; Not for 5, but again have hits for 6, and 7 and you do the fit_test, I find that it does not fit Poisson.
Glad to see that you can now use the FIT_TEST function. It would be surprising to find that there were no intervals with 5 hits in a sample of 200 which follows the Poisson distribution.
Charles
Charles,
Excellent website, examples and free tools!
Thank you so much!
Similar to ndm above I am unable to find the FIT_TEST.
I downloaded the latest version on the download page, but still was not able to find it.
I am working on Excel 2010.
I can see all other functions including the CHI-Square Test.
Any help would be appreciated.
Regards
ST
ST,
The FIT_TEST function was introduced in Release 2.17 on 1 September 2014, and so should work on any version of the software that has a higher version number, which can be determined by inserting the formula =VER() in any cell.
Not seeing FIT_TEST is quite strange. I am using Release 3.2.1, working in Excel 2010, and the FIT_TEST function works fine.
What do you see when you try to enter the function in a cell? Do you see #NAME? What do you see when you enter the CHI_TEST function?
Caution: If you try to locate any of the Real Statistics functions using the formula bar, you will find them all under the User Defined cateory. In any case, you should be able to enter =FIT_TEST(…. in a cell just like any Excel formula.
Charles
Zaiontz: Sir, you are a gentlemanly wizard! thanks so much for your work and your website. i found you weeks ago looking for Fisher’s Exact Test help, but you have really provided a superlative service here with all of your offerings–both theory and tools! (i’ve bookmarked your site, of course.)
Say, i was testing an observed range against an expected range and used CHISQ.TEST. but i wanted to use your handy FIT_TEST(R1, R2, par) instead, but it didn’t run. do i need to re-install your Real Statistics Resource Pack?
This function was only included in the latest version of the software, and so you would need to re-install the software if you don’t have the latest release. All you need to do is download the software and replace the existing version with the new version. Provided you don’t change the location or name of the file you don’t need to do anything else.
I plan to issue yet a new release in a few days.
Charles
thanks, Charles–that worked! (and i’ll keep an eye out for the new release.)