Sample covariance
Definition 1: The (sample) covariance between two samples {x1, …, xn} and {y1, …, yn} is a measure of the linear association between two variables x and y based on the corresponding samples, and is defined by the formula

Observation: The covariance is similar to the variance, except that the covariance is defined for two variables (x and y above) whereas the variance is defined for only one variable. In fact, cov(x, x) = var(x).
The covariance can be thought of as the sum of matches and mismatches among the pairs of data elements for x and y: a match occurs when both elements in the pair are on the same side of their mean; a mismatch occurs when one element in the pair is above its mean and the other is below its mean.
The covariance is positive when the matches outweigh the mismatches and is negative when the mismatches outweigh the matches. The size of the covariance in absolute value indicates the intensity of the linear relationship between x and y: the stronger the linear relationship the larger the value of the covariance will be.
Sample correlation
The size of the covariance is influenced by the scale of the data elements, and so in order to eliminate the scale factor, the correlation coefficient is used as a scale-free metric of the linear relationship.
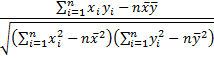
Definition 2: The (sample) correlation coefficient between the two samples is a scale-free measure of linear association and is given by the formula
![]()
When necessary, we write r as rxy to explicitly show the two variables.
We also use the term coefficient of determination for r2
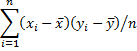
Observation: Just as we saw for the variance in Measures of Variability, the covariance can be calculated as
![]()
As a result, we can also calculate the correlation coefficient as
Population covariance and correlation
We have defined covariance and the correlation coefficient for data samples. We can also define covariance and correlation coefficient for populations, based on their probability density function (pdf).
Definition 3: The population covariance between two random variables x and y for a population with a discrete or continuous pdf is defined by
![]()
where E[] is the expectation function as described in Expectation.
Definition 4: The (Pearson’s product-moment) correlation coefficient for two random variables x and y for a population with a discrete or continuous pdf is
![]()
Correlation Properties
If r is close to 1 then x and y are positively correlated. A positive linear correlation means that high values of x are associated with high values of y and low values of x are associated with low values of y.
If r is close to -1 then x and y are negatively correlated. A negative linear correlation means that high values of x are associated with low values of y, and low values of x are associated with high values of y.
When r is close to 0 there is little linear relationship between x and y.
Click here for the proofs of these properties.
Covariance Properties
Property 4: For any constant a and random variables x, y, z, the following are true both for the sample and population definitions of covariance.
- cov(x, y) = cov(y, x)
- cov(x, x) = var(x)
- cov(a, y) = 0
- cov(ax, y) = acov(x, y)
- cov(x+z, y) = cov(x, y) + cov(z, y)
Property 5: The following is true for both the sample and population definitions of covariance:
If x and y are independent then cov(x, y) = 0
and so the correlation coefficient is also zero.
Observation: The converse of Property 5 is not true, as the following counter-example shows. Consider the random variable on the domain {-1,0,1} where P(x=-1) = P(x=1) = .5 and P(x=0) = 0. Now, define the random variable y = x2. Clearly, x and y are not independent; in fact, if you know x then y is completely determined. But it is easy to calculate that the correlation between x and y is zero (see Figure 1).
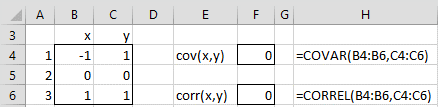
Figure 1 – Counter-example
Observation: It turns out that if x and y are bivariate normally distributed and uncorrelated (i.e. cov(x, y) = 0) then x and y are independent.
Property 6: The following properties are true both for samples and populations:
![]()
![]()
Click here for the proofs of these properties.
Unbiased Estimates
It turns out that r is not an unbiased estimate of ρ. A commonly used, relatively unbiased estimate of ρ2 is given by the adjusted coefficient of determination 
![]()
While 
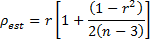
An even more unbiased estimate of the population correlation coefficient associated with normally distributed data is given by
 Excel Functions
Excel supplies the following worksheet functions for arrays R1 and R2 with the same number of elements:
COVARIANCE.P(R1, R2) = the population covariance between the data in R1 and R2
COVARIANCE.S(R1, R2) = the sample covariance between the data in R1 and R2
CORREL(R1, R2) = the correlation coefficient between the data in R1 and R2
RSQ(R1, R2) = the coefficient of determination between the data in R1 and R2; this is equivalent to the formula =CORREL(R1, R2) ^ 2.
No distinction needs to be made between the population and sample correlation coefficients in CORREL since they have the same values.
If R1 contains data {x1,…,xn}, R2 contains {y1,…,yn}, 

This is the same as the formula given in Definition 1, with n replaced by n – 1.
Older Excel Functions
COVARIANCE.P and COVARIANCE.S are not supported in versions of Excel prior to Excel 2010. For these earlier versions, Excel only supplies a function for the population covariance, namely COVAR (or the equivalent function PEARSON), which is equivalent to COVARIANCE.P. The sample covariance can be calculated using the formula
=COUNT(R1) * COVAR(R1, R2) / (COUNT(R1) – 1)
Note that CORREL(R1, R2) = COVAR(R1. R2) / (STDEVP(R1) * STDEVP(R2)).
Also note that if all the elements in R1 (or R2) are identical, the standard deviation will be zero, and so CORREL(R1, R2) will have the error value #DIV/0!
Handling Missing Data
Example 1: Calculate the correlation coefficient between revenue growth and marketing budget growth based on the seven companies in range A3:C10 of Figure 2.
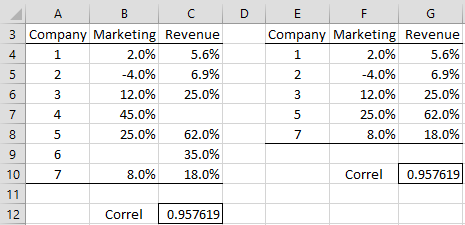
Figure 2 – Correlation coefficient
The correlation coefficient is .9576 (cell C12) as calculated by the formula =CORREL(B4:B10, C4:C10). This indicates that there is a high positive correlation between revenue growth and the growth in the marketing budget.
Note that Excel ignores pairs of data for which one or both of the data elements in the pair are empty or non-numeric. Thus companies 4 and 6 are ignored in the calculation of the correlation coefficient in Example 1; i.e. the formula =CORREL(F4:F8, G4:G8) calculates the same value for the correlation coefficient.
Data Analysis Tools
Excel also provides Covariance and Correlation data analysis tools. See, for example, Example 1 of Multiple Correlation.
Real Statistics Functions
The Real Statistics Resource Pack furnishes the following worksheet functions:
RSQ_ADJ(R1, R2) = adjusted coefficient of determination 
CORREL_ADJ (R1, R2) = estimated correlation coefficient ρest for the data sets contained in ranges R1 and R2.
RSQ_ADJ(r, n) = adjusted coefficient of determination
CORREL_ADJ (r, n) = estimated correlation coefficient rest for a sample of size n with correlation coefficient r.
The Real Statistics Resource Pack also supports the COVARS and COVARP functions, which are equivalent to COVARIANCE.S and COVARIANCE.P, and may be useful to users of Excel 2007 and Excel 2011.
Worksheet Functions Example
Example 2: Figure 3 illustrates the use of the various Excel and Real Statistics worksheet functions described on this webpage.
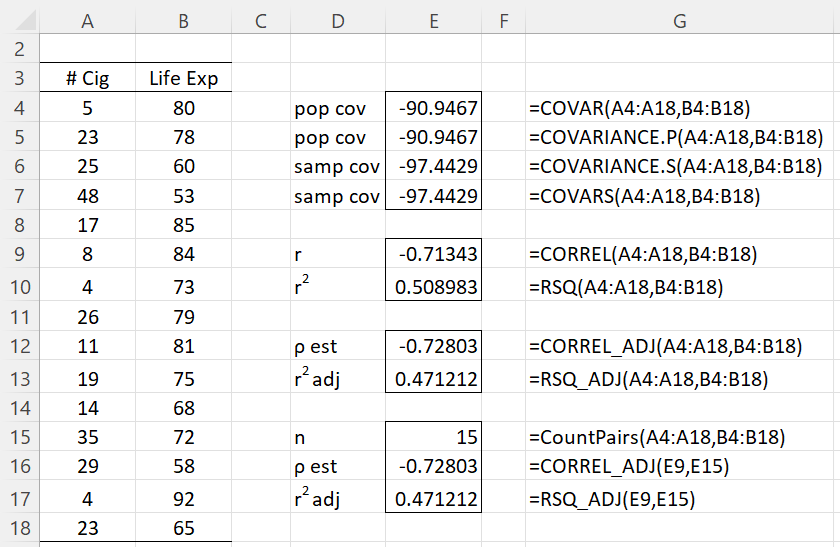
Figure 3 – Examples
Finally, the Real Statistics array functions CORR, COV and COVP can be used to create a matrix of pairwise covariance and correlation coefficients, as described at Least Squares for Multiple Regression.
Correlation for Frequency Tables
The correlation coefficient can be calculated for data in the form of a frequency table. The approach is similar to that described in Frequency Table Conversion.
Example 3: Calculate the correlation coefficient for the data in the two-sample frequency table shown in range A3:C8 of Figure 4. Here, the two samples, s1 and s2, share the frequency counts shown in column C.
The result is -.84055 (cell F8) calculated based on Definition 2 as shown in the figure. This result can also be calculated by the array formula shown in cell I9.
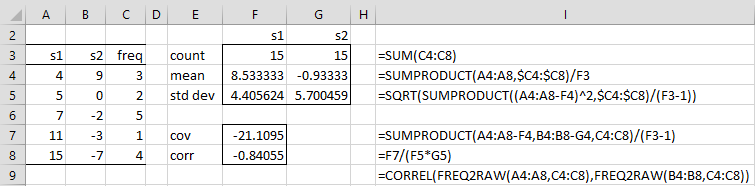
Figure 4 – Correlation coefficient for a frequency table
Examples Workbook
Click here to download the Excel workbook with the examples described on this webpage.
References
Howell, D. C. (2010) Statistical methods for psychology, 7th Ed. Wadsworth. Cengage Learning
https://labs.la.utexas.edu/gilden/files/2016/05/Statistics-Text.pdf
Wikipedia (2012) Correlation coefficient
https://en.wikipedia.org/wiki/Correlation_coefficient
why correlation as linear relation ship between two variables is measured as E[(x-muX)(y-muY)]/sigma x sigma y
This is the formal definition of correlation.
Charles
Dr Charles
Thanks a lot for this nice website..
I have a query on finding the correlation between variables of different types.
I am trying to find the correlation between a discrete variable( count ) and a set of continuous variables (temperature, rainfall etc). Could you please suggest the best method to find the correlation between a discrete and continuous variable.
Hello Anjana,
It depends on how you plan to use the correlation statistic, but the simplest approach is to use the ordinary Pearson’s correlation coefficient.
Charles
Hi,
I am trying to find the relationship between student engagement and increase in academic achievement. The t-test shows significant increase in academic achievement of the experimental group w.r.t to the pre test as well as the post test of the control group. (both groups have n =30). I have used a survey to measure student engagement and have taken focus group discussions. Now, what next? Seem to have reached a roadblock. Could you (and other researchers) following the thread give some insight?
Hi Ajita,
1. It seems like you have two factors: Time (pre vs post, this is a repeated measures or paired factor) and Group (experimental vs control). It is not clear to me what hypothesis yielded a significant result.
2. I don’t understand what you mean by “roadblock”. What sort or roadblock are you referring to?
Charles
Hi Charles,
1. Yes. There is a significant increase in the scores of the pretest and post test of the experimental group. The post test scores of experimental group are also higher than the post test scores of the control group. Used t test. Suggests that the intervention is effective.
2. took focus group discussions and a survey regarding the intervention. During Focus group discussion students revealed the effectiveness of the intervention. When I do the correlation, the results are positive but weakly correlated.
Now how do I put this and the focus group discussion data together?
Thanks
HI Ajita,
1. Excellent.
2. This doesn’t seem like a statistics question, at least from a quantitative/mathematical perspective. I don’t know how to put these data together.
Charles
Thanks Charles.
Could you just confirm my understanding that if the t-tests results are significant, then there is no need to do the correlation analysis?
Yes. See my previous response.
Charles
Thank you so much Charles. It has resolved a major issue for me.
Just to add, do I need to do the correlation when the ttests actually mean the same? (I just read the article on relationship of correlation and t test)
Ajita,
It is probably not necessary to perform correlation testing since it is equivalent to the t test (as you just read).
Charles
Hi Charles,
I have a bigger question of sorts. I normally do ANOVA or ANCOVA so the idea of having a pre-treatment dv and post-treatment dv is straightforward. BUT, what if you are doing simple old correlation and you have 1 continous predictor and a pre-test continous score and then a post-test continous score for dvs. The student is using a change score between the two criterions on her entire analysis starting with the assumptions. This seems wrong to me. The student has a small sample size and is doing a Kendall’s tau-b. I would at least ask that the student reports the two correlations and then can look at the change score, but using the change score for the assumptions seems odd. Can you shed any light on what the standard would be here?
Hi McCulloch,
Can you describe the situation in a little more detail since I haven’t completely understood it. What hypothesis is being tested?
Charles
Hi Charles, I have a question
We can use CORR(X,Y)*DESVEST(X)*DESVEST(Y) to compute COVAR(X,Y), when CORR(X,Y) is the Pearson’s Correlation.
Now, we can use the same formula to compute COVAR(X,Y), when CORR(X,Y) is the Spearman’s Correlation?
Thank you.
Mauricio,
Yes, this formula can be used to compute COVAR (assuming that CORR is CORREL in some other language and DESVEST is STDEV.
You should be able to use the same formula to compute Spearman’s version of the corvariance function from CORR provided that X and Y represent the ranks of the original data values.
In any case, you can try this out yourself by using some made-up data.
Charles
Hi charles, i found difficulty to understand the parametric and nonparametric data using pearson correlation and spearman correlation. Can you please give me the detailed explaination with examples for pearson and spearman correlation?
Min,
Data is neither parametric nor nonparametric. It is the test that is parametric or nonparametric. Generally a nonparametric test is used when one of the assumptions for the typical parametric test is not met. Typically nonparametric tests have fewer assumptions and so it is easier to justify its use.
See Spearman’s Correlation for an explanation.
Charles
Hi charles, can you share to me on how to interpret the standard deviation, specifically to determine the homogeneous and heterogeneous value of SD. Can you give me the specific range for the value close to mean score, disperse, less disperse and widely disperse.
Min,
Sorry but I don’t understand your question.
Charles
Hi charles, is it ok to correlate the mean scores of x (dependent variable) and y (independent variable )?
What are some considerations when we use pearson or spearman correlation?
Min,
You can correlate any two sets of numbers of the same size as long as each set has at least 2 values.
Generally you use Pearson’s correlation. Use Spearman’s as explained at
Spearman’s Correlation
Charles
Hi Charles,
I did split half realibility method.correlation coefficient is .60. Spearman-Brown correction is 1.50. Do you think it is high or low?
Thanks in advance.
Yasyas,
I don-t think that Spearman-Brown can be higher than 1.0.
Charles
sorry ı wrote incorrect. Spearman-brown is 0.67.correlation coefficient is .60. Is realibilty high or low?
There isn’t agreement on what is a high level of reliability. Some say .80 is high, otherwise use a lower value. To me 0.67 is probably at the lower end of acceptable reliability, but this is just an impression.
Charles
Hi, Dr. Charles!
Thank you for a developing a very helpful tool.
a) I just want to know why there is no agreed level of reliability.
b) Is there any other tool I can use to justify level of reliability?
c) I have a Chronbach’s alpha of 0.6248 and my interpretation is that there is a high level of reliability. Am I correct in saying this?
Hello Mikol,
a) This is subjective and so we shouldn’t necessarily expect agreement.
b) There are many tools available, but Cronbach’s alpha is the one that is most commonly used.
c) I would probably say that this is borderline acceptable, but again there isn’t agreement about the interpretation.
Charles
Hi Charles,
I was wondering if you could help me: Prior to starting statistical analysis of my variables, I’m trying to look at the correlation between 4 dependent variables in order to focus on one of them.
I conducted a pairwise correlation matrix on Stata. Two questions:
1 – Would you suggest undergoing further correlation tests? If so, which?
2 – How strong does the correlation have to be for me to ignore the variable?
Maira,
1. It really depends on what hypotheses you want to test.
2. What criterion are you using for ignoring a variable? You can test a pair of variables to see whether its correlation is significantly different from zero. See
https://real-statistics.com/correlation/one-sample-hypothesis-testing-correlation/
Charles
Sir I have a questionnaire responses of around 100 people regarding how much 10 parameters influence certain thing in scale range 0 to 4 with 0 no effect and 4 max effect. I have calculated correlation among these 10 parameters and they are highly correlated based on questionnaire responses.
Is there any possibility to check how much i parameter influence j parameter on a scale range from 0 to 9 using result of correlation?I want to use questionnaire response as an input to Analytic Hierarchical Process(AHP) which requires influence of one parameter on another in scale of 0 to 9.
Thanks in advance for your help.
Anureet,
If by “how much i parameter influence j parameter” you mean the correlation between these two parameters, then I can think of many ways of assigning a value between 0 and 9. One approach is to use the RANK.AVG function on these values and then rescale the results to values between 0 and 9.
I am not familiar with AHP so I can’t say whether this is the approved method for use by AHP.
Charles
Dear Charles,
I have to do a set of correlation analysis for several pairs of variables.
I have 6 variables measured on each subject of the sample and I have to verify if there is a correlation between one of these variables versus the other 5 time by time.
As I understand the r Pearson’s coefficient computation assumes that the input data are normally distributed and the absence of outliers.
I did normality check and I verified the presence of some outlier. After removing them, I repeated the normality check, but some of the samples that weren’t identified as outliers at the first check, now become outliers! Thus I removed also these ones and so on.
By repeating more times the “check and remove” step, finally I obtained a data set without any outlier, but I had to remove a total 13 out of the original 57 samples!
So I’m wondering if what I’m doing makes sense or if I’m completely wrong.
Thank you for your help
Best Regards
Piero
Piero,
What you are doing makes sense and it is entirely possible to remove a large number of data elements as potential outliers. Whether or not the approach you used was appropriate in the circumstances you were dealing with, I can’t see based on the limited exposure I have.
Charles
Really great explanation. One thing I am curious about: what exactly is the correlation coefficient. I understand its interpretation and how to use it, but I wonder what the number is made of. Is it the slope of the variables’ data points?
Caroline,
Yes, it is the slope of the regression line (aka trendline) that is the best fit of the various points in the sample.
Charles
Sx and Sy in definition 2 formula stands for what? Thanks
Tukur,
sx is the standard deviation for x and sy is the standard deviation for y.
Charles
I did a covar(R1,R1) and got a result of 62.4.
Is this the expected value of a “covariance identity”?
Hard to interpret the rest of my results until this is
clear to me. For uncorrelated date, I see small single
digit positive and negative covariances, so that makes
(relative) sense.
Thanks in advance for your feedback!
Richard,
I don’t know what you mean by a covariance identity. This term usually refers to a covariance matrix, not a single value.
Note that COVAR(R1,R1) is the same as VARP(R1), i.e. the population variance.
Charles
What is meant by the operator E[], as in E[(x-µx)(y-µy)]?
Dan,
The expectation function. See the following webpage https://real-statistics.com/general-properties-of-distributions/expectation/
Charles
OK thank you. I guess, since one can enter into these pages at very many points, that it would be good to explain E in the text. And the “pdf” I guess has to do with degrees of freedom?
Dan,
You bring up some good points. I have just made a few changes to the referenced webpage to addresses these points.
By the way, pdf = probability density function.
Charles
Thank you very much for your prompt reply. Your pages are excellent, although there is, as always, room for improvement.
Hello Charles,
Very impressive explanation of various statistical calculations.
I have to figure out premium estimation on a set of prospect data within a particular industry. I have the sales volume data and need to find out the premiums. In order to complete that, I obtained customer data with the same criteria and need to find out a correlation multiplier between the customer premium and customer revenue which I can use to divide the prospect sales volume in order to obtain premium. Would you be able to direct me as to which formula to use?
Martina,
It sounds like you want to perform a regression. See the Regression webpage.
Charles
I have computed correltion in the group of 3 variables (a*b, b*c. a*c) using excell. The value of correlaion of subgroups either came out to be greater or less than the correlation value of total group. Is this possible and if yes, why?
Sorry, but I don’t understand what you mean by the correlation of the total group. If you send me an Excel file with your data and calculations, I will try to answer your question. You can find my email address at Contact Us.
Charles
Hello
I am working on a report in which I have chosen certain parameters which are state wise population growth of a country as independent variable and its impact on growing demand on housing (dependent variable ) and I have also consider the amount which has been disbursed (dependent variable ) in order to meet the demand by then population. how can I apply correlation and regression model in order to understand the impact of independent variable on other variables
Rhitz,
This sounds like a multiple regression problem. Please look at the regression portion of the website. You can start with the following webpages:
Linear Regression
Multiple Linear Regression
Charles
what is the definition of correlated pairs?
Viqui,
I don’t know of a precise definition of correlated pair, but probably it is a pair of samples with a correlation that is significantly different from zero.
Charles
Hi ,
How can I find the joint probability distribution from given correlation?
Vinnie,
In general, you can’t find the joint probability distribution from the correlation.
Charles
Hello Charles!
What is the relation between correlation and joint probability distribution of two random variables?
Reznik,
The correlation coefficient is a statistic (or parameter) for joint probability distribution of two random variables.
Charles
What the difference between adjusted coefficient correlation and adjusted coefficient of determination ?
Thanks
vic
Vic,
The coefficient of determination is the square of the correlation coefficient. The adjusted value tries to modify the sample statistic so that it is a more accurate (i.e. less biased) approximation of the corresponding population parameter.
Charles
Dear Charles,
I want to test the relationship between AMH in plasma samples obtained from Holstein cows and their response to super stimulation by a gonadotropic hormonal preparation. the question is how to interpret such correlations into an excel figure (x, y figure) using Excel 2007 or newer versions
Many thanks
Dear Rabie,
Sorry, but I don’t completely understand what you mean by “interpret such correlations into an excel figure (x, y figure)”. Are you trying to chart the correlation via a trend line in Excel? Are you trying to interpret such a trendline? Please explain.
Charles
Dear Charles,
I am conducting a study which measures the relationship between three variables; quality of life, medication adherence and healthcare satisfaction. Research suggests that all three variables directly affect one another (a triangular-shaped relationship). I am wondering what a relationship between three variables is called?
Many thanks
AQ,
Of course it depends on the relationship that you are referring to, but probably you are looking for “they are correlated” or “they have an association”.
Charles
Hello Charles,
I have a quick question regarding ANOVA and correlation factor, I am trying to analyze different experiments to test treatments. I get inconsistent and not high enough correlation factors to prove linear relationship among the variables. I also ran a one way anova and I get a p value of 0.000 using minitab.
Can we only use ANOVA when there is a linear relationship? or can I trust my results and if so what can I determine from them?
I would appreciate any help, thanks!
Martin,
You should be able to run ANOVA without making a separate test for correlation. This should come out of the ANOVA results anyway. If you are getting inconsistent results perhaps you have made an error in conducting one of the tests. Without better information about your scenario I am unable to comment further.
Charles
Dear Charles,
I am having 30 sample size and need to test relationship with individual age, education level with their perception towards several variables which measures using likert scale.(+1 strongly agree to -1 strongly disagree).
can I use pearson correlation test to measure correlation between two group of this sample:
for example my hypothesis will be:
educated officers have best choice of selecting best employee or
experiences of officers have positive relationship with best practices of officers etc.
I have data on age and education level as categorical data and perception as ranking data.
hope you can understand my issue
thanks
Nirosha
Nirosha,
The more likert scales you have, the more accurate tests that are designed for continuous data. With 7 scales (e.g. strongly agree, fairly strongly agree, mildly agree, neutral, mildly disagree, fairly strongly disagree, strongly disagree), a continuous test should generally work fine. It is also common to use such a test with a 5-point scale, although there is more risk. Better yet would to assign any value between -1 and +1.
You can certainly use pearson’s correlation to measure the associations that you have listed. You can also test whether these correlation coefficients are significantly different from zero. Provided the data is at reasonably normally distributed this is equivalent to conducting a t test. See the webpage Relationship between correlation and t test.
You have stated that you plan to compare two groups. You can also compare more than two groups. This is equivalent to running ANOVA.
Charles
am hapi wt d work ur doing, pls I’m working on gender and socioeconomic status as correlates of students’s academic achievement. pls what statistical tool should I use to analyze the data..tanx in advance
Jane, it really depends on what hypothesis you are trying to test. The Correlation sections describes a number of tests that you could use. See the webpage
Correlation
Charles
I have a large data set. I am trying to determine the correlation a distance variable and a probability variable. The distance is in increments of 5 (there are 1000+ data points for each distance increment). Most of the probabilities are zero (~10%). If I run Excel Correl() on the complete data, there is very little correlation. If I run Correl() on the average probability for each distance, there is strong correlation. Am I using Correl() in some way that is violating the built in assumptions?
Eric,
There are no assumptions for using the Correl function. There may be some assumptions when you test the correlation value.
Without seeing your data, I can’t tell you why you are getting such different results.
Charles
Dear, Excuse me, I am very confused that How to find R1 and R2 please details inform me. thanks
R1 and R2 are two ranges on an Excel spreadsheet which contain the data for the two samples.
Charles
Im trying to work out the Standard deviation on Excel, and some of the cells contain a (0) which results in the function returning with an error code.
Does anyone know how I can get around this?
Thanks,
Steve
Steve,
Just because some of the cells contain a zero shouldn’t necessarily result in the standard deviation function STDEV.S returning an error.
If you send me an Excel file with your data, I can try to figure out where the problem is.
Charles
Greetings Charles,
I’ve more than 500 relationship (one to one function) to be study either they have a possible relationship or not. Therefore my first step is by using Correlation Coefficient to segregate the possible relationship or not before move to the next step.
My question, is that okay to used that method to find the possible relationship or there is another method of that more reliable to segregate those one to one into possible relationship group and vise versa.
Sorry, but you haven’t provided enough information for me to answer your question.
Charles
For example, in crude assays there are hundred of parameter (properties, such as sulfur content, Specific Gravity, viscosity and etc).
This one to one function, for example Sulfur vs SPG or Sulfur vs Viscosity and so on. The study is to find any possible relationship among the properties of crude oil.
Since the study doesn’t really wide and only few people attempt to do the statistical analysis on whole crude oil, I have to start with random variables.
So, I wonder if I can segregate the possible relationship just by using coefficient of determination or there is another method that much better compared to R-square.
Sorry but thank you in advance.
Sorry Akira, but I don’t understand your question.
Charles
Hi, something is the matter with the radj formula: (i) it cannot give negative r coefficients (I guess one needs to add a “sign(r)” factor before the sqrt; (ii) the content of the square root can be negative. Eg. when N=4 all r between -0.58 and 0.58 produce imaginary sqrt.
Alessio,
You are correct. For this reason it is better to speak about the adjusted coefficient of determination (the square of the correlation coefficient). I have now changed the webpage to reflect this. Thanks very much for identifying this problem.
Charles
Greetings Charles!
Weldone for this rich site. Pls can I run CORREL on two sets of data with different units. Eg. X has units in molecules/cm^2 while Y has units in molecules/cm^3. Thanks in advance
Emeka,
Yes, the units won’t matter. The correlation coefficient is independent of the units.
Charles
Hi!
I have an important correlation related question:
I am analyzing spiking Neurons.
I have 4 Island each contains 16 spiking neurons. Each neuron fires spikes randomly in a time frame of 250 us.
I want to find the correlation between this 4 islands, how can i do it ?
Hi Ramon,
I suggest that you look at the Multiple Correlation – Advanced webpage.
Charles
Thanks a lot Charles. Now I can find my way better.
hi
may you please explain about correlation coeficient in multi variables i.e. y and x1,x2,x3,…
y=ax1+bx2+bx3+…. how to find a,b,c,… so that we attain best fitting.
This is what regression is all about. Please look at the Linear Regression and especially the Multiple Regression webpages.
Charles
Hello,
I’m using excel to do a quick correlation. I was reading through the variables. I’m trying to make a correlation between performance metrics (rating scale is 1-5) and Versant Exam scores (rating is 1-100). Would it matter if the scales are different when I do the correlation?
Tanya,
You can calculate the correlation coefficient even if the scales are different.
Charles
Hello sir Charles. May I know if what type of correlation should I use if N of my X(independent variable) and Y (dependent variable) can’t be pair? Meaning like for instant I have n = 57 for my X and n = 12 for my Y
Jas,
If you can’t pair the x and y samples, you don’t have any correlation statistic.
Charles
Hi
Please can you help about finding correlation coefficient between two dependent variables, each variable with four level but I want to find over all correlation between the two dependent variables without making regards for the levels which I do not know how to do it. Any insight will be helpful. Many thanks.
Tara,
Sorry, but I don’t understand your question. In particular I don’t understand what levels you are referring to. Are these part of an ANOVA?
Charles
Thanks Charles
Yes the levels are part of an ANOVA. I meant I want to find correlation between two dependent variables over the 4 levels that factor have. And My question is that can I use mean value for each level when I calculate correlation between ? if so I think I will be able to have correlation over that 4b levels of the two dependent variables.
Tara,
I am afraid that I still don’t understand your question.
Charles
I am sorry that I have not been able to explain my question.
For each dependent variable there are 2 factors one factor has 4 levels and the other factor has 2 levels. I can separate the factor with two levels when I test correlation but I want to keep the 4 levels together of the other factor when I test correlation. So I want to test correlation for factor 1 (a,b,c,d) with factor 2(a) then find correlation between factor 1(a,b,c,d) with factor 2(b). I test correlation between two dependent variables. Is this possible?
If so, can I use mean value of levels(a,b,c,d) when I test correlation?
I hope I could explained my question well.
Thanks a lot.
Tara,
I’m not sure why you want to do this, but in any case here my response to your question based on my understanding of what you are asking.
Suppose the data for 4 variables x1, x2, x3 and x4 are contained in the range R1 (with 4 columns, one for each variable) and the data for another variable y is contained in the range R2 (with 1 column and the same number of rows as R1). The correlation of x1, x2, x3 and x4 with y can be calculated by the Real Statistics formula MultipleR(R1, R2). This is essentially the R value in multiple linear regression.
The Correlation test described in Correlation Testing is between two variables x and y. If you define the x sample values as the mean of the corresponding values of x1, x2, x3 and x4, you can then test the correlation of x with y. It is not clear to me why this would be useful though.
Charles
question then is wh
Thank you for your prompt response.
If I don’t possess entity level information for any participants within category subgroups can I really correlate subgroups between categories?
Though I possess the standard deviations and means of the categories and subgroups within categories, I don’t see how I can calculate covariance. If I can’t calculate covariance is there another way to calculate correlation?
You clearly need more than just the means and standard deviations of the samples to calculate the covariance, and, as you observed, you need to know the covariance to calculate the correlation.
Charles
Mr. Zaiontz,
Great website in so many respects.
Have a correlation question for you.
Here is my data structure:
1. Over fifty categories with the same two subgroups per category. Subgroup 1 Passes and Subgroup 2 Fails.
2. Not all categories possess the same size subgroups and not all categories are the same size.
3. Data for each category contains both subgroup means and standard deviations as well as the overall category mean and standard deviation.
4. The same participant population was evaluated in all categories. A fail in one category is also a fail in all the other categories.
Question:
With data formatted in this manner is it possible to correlate the categories?
Any insights would be helpful.
Sorry, but I don’t completely understand the premise.
Charles
can you please explain pair wise correlation ?
Jerome,
If you have say 4 variables A, B, C and D, there are C(4,2) = 6 different pairs of these variables, namely AB, AC, AD, BC, BD, CD. Correlation coefficients are calculated on pairs of variables. Thus with 4 variables there are are 6 pairwise correlations, namely correlation(A,B), correlation(A,C), etc.
Charles
Hi Charles,
Is it possible obtain any extra information from the correlation value? For example, if I have a correction value of 0,85 could we say that 85% of the values correlate. Or can we say that all values correlate with 15% error?
Thanks in advance.
John,
Neither of these is true, although you could say that it is 15% short of perfect correlation.
Charles
what is meant by the definition of correlation coefficient ” The correlation coefficient between two sample variables x and y is a scale-free measure of linear association between the two variables, and is given by the formula,” specifically scale-free measure? Please respond as soon as possible as this is for a project due this Sunday. Thank you for your time. -John G.
John,
The correlation coefficient is a measure of the linear association between the two variables, but it is not scale-free. E.g. if the sample for variable x is {3,4,5,1,5} and the sample for variable y is {5,2,7,3,4}, then the covariance coefficient is 1.08. If instead I multiply each of the sample elements by 10, the covariance coefficient will be 108, i.e. 10 x 10 = 100 times higher. Thus the covariance coefficient is not scale-free since scale matters (here scale means the size of the input data, not just their relationship to each other).
The correlation coefficient is an attempt to make the covariance coefficient scale-free. In this way only the relationship between the two variables is captured. Using the above example, the correlation coefficient for the original samples is .419425, the same as the correlation coefficient for the samples that are 10 times bigger. This is a scale-free measure. In fact, no matter what the size of the original data the correlation coefficient has a value between -1 and +1. The closer the correlation coefficient is to +1 the better (higher) the linear association between the two variables (i.e. when x is high, y tends to be high too and when x is low, y tends to be low). The closer the correlation coefficient is to 0 the worse (lower) the linear association between the two variables.
The same is true in the negative range, namely the closer the correlation coefficient is to -1 the better (higher) the linear association between the two variables, except that this time the association is the inverse of the positive association (i.e. when x is high, y tends to be low and when x is low, y tends to be high).
Charles