In Correlation Basic Concepts we define the correlation coefficient, which measures the size of the linear association between two variables. We now extend this definition to the situation where there are more than two variables.
Multiple Correlation Coefficient
Definition 1: Given variables x, y, and z, we define the multiple correlation coefficient

where rxz, ryz, rxy are as defined in Definition 2 of Basic Concepts of Correlation. Here x and y are viewed as the independent variables and z is the dependent variable.
Coefficient of Determination
We also define the multiple coefficient of determination to be the square of the multiple correlation coefficient.
Often the subscripts are dropped and the multiple correlation coefficient and multiple coefficient of determination are written simply as R and R2 respectively. These definitions may also be expanded to more than two independent variables. With just one independent variable the multiple correlation coefficient is simply r.
Unfortunately, R is not an unbiased estimate of the population multiple correlation coefficient, which is evident for small samples. A relatively unbiased version of R is given by R adjusted.
Definition 2: If R is Rz,xy as defined above (or similarly for more variables) then the adjusted multiple coefficient of determination is
![]()
where k = the number of independent variables and n = the number of data elements in the sample for z (which should be the same as the samples for x and y).
Data Analysis Tools
Excel Data Analysis Tools: In addition to the various correlation functions described elsewhere, Excel provides the Covariance and Correlation data analysis tools. The Covariance tool calculates the pairwise population covariances for all the variables in the data set. Similarly, the Correlation tool calculates the various correlation coefficients as described in the following example.
Example 1: We expand the data in Example 2 of Correlation Testing via the t Test to include a number of other statistics. The data for the first few states are displayed in Figure 1.
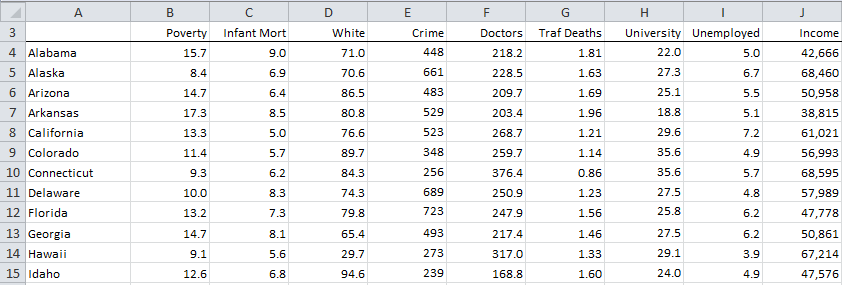
Figure 1 – Data for Example 1
Using Excel’s Correlation data analysis tool we can compute the pairwise correlation coefficients for the various variables in the table in Figure 1. The results are shown in Figure 2.
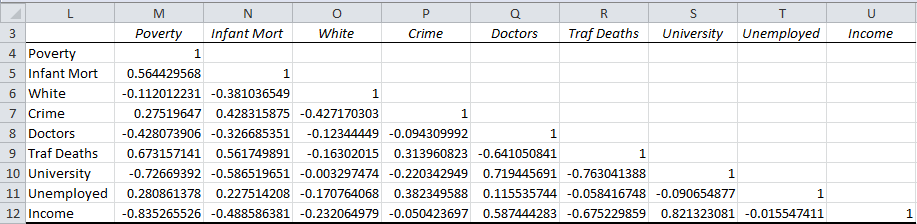
Figure 2 – Correlation coefficients for data in Example 1
We can also single out the first three variables, poverty, infant mortality, and white (i.e. the percentage of the population that is white) and calculate the multiple correlation coefficients, assuming poverty is the dependent variable, as defined in Definitions 1 and 2. We use the data in Figure 2 to obtain the values 


![]()
![]()
Partial and Semi-Partial Correlation
Definition 3: Given x, y, and z as in Definition 1, the partial correlation of x and z holding y constant is defined as follows:

In the semi-partial correlation, the correlation between x and y is eliminated, but not the correlation between x and z and y and z:
Causation
Suppose we look at the relationship between GPA (grade point average) and Salary 5 years after graduation and discover there is a high correlation between these two variables. As has been mentioned elsewhere, this is not to say that doing well in school causes a person to get a higher salary. In fact, it is entirely possible that there is a third variable, say IQ, that correlates well with both GPA and Salary (although this would not necessarily imply that IQ is the cause of the higher GPA and higher salary).
In this case, it is possible that the correlation between GPA and Salary is a consequence of the correlation between IQ and GPA and between IQ and Salary. To test this we need to determine the correlation between GPA and Salary eliminating the influence of IQ from both variables, i.e. the partial correlation }")
Property
Property 1:
![]()
![]()
Proof: The first assertion follows since
![]()
![]()
The second assertion follows since:
Example 2: Calculate 
}")
![]()
![]()
We can see that Property 1 holds for this data since
![]()
![]()
Partitioning Variance
Since the coefficient of determination is a measure of the portion of variance attributable to the variables involved, we can look at the meaning of the concepts defined above using the following Venn diagram, where the rectangular represents the total variance of the poverty variable.

Figure 3 – Breakdown of variance for poverty
Using the data from Example 1, we can calculate the breakdown of the variance for poverty in Figure 4:
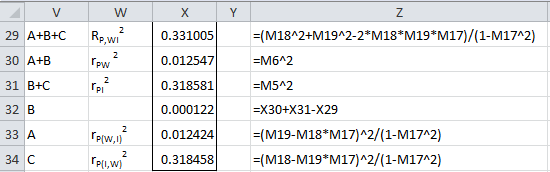
Figure 4 – Breakdown of variance for poverty continued
Note that we can calculate B in a number of ways: (A + B – A, (B + C) – C, (A + B + C) – (A + C), etc., and get the same answer in each case. Also note that
![]()
![]()
where D = 1 – (A + B + C).
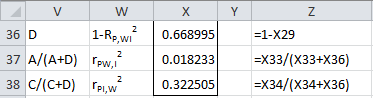
Figure 5 – Breakdown of variance for poverty continued
Property 2: From Property 1, it follows that:
![]()
If the independent variables are mutually independent, this reduces to
![]()
Worksheet Functions
Real Statistics Functions: The Real Statistics Resource Pack contains the following functions where the samples for z, x, and y are contained in the arrays or ranges R, R1, and R2 respectively.
CORREL_ADJ(R1, R2) = adjusted correlation coefficient for the data sets defined by ranges R1 and R2
MCORREL(R, R1, R2) = multiple correlation of dependent variable z with x and y
PART_CORREL(R, R1, R2) = partial correlation rzx,y of variables z and x holding y constant
SEMIPART_CORREL(R, R1, R2) = semi-partial correlation rz(x,y)
Multiple Correlation for more than 3 variables
Definition 1 defines the multiple correlation coefficient Rz,xy and the corresponding multiple coefficient of determination for three variables x, y, and z. We can extend these definitions to more than three variables as described in Advanced Multiple Correlation.
E.g. if R1 is an m × n array containing the data for n variables then the Real Statistics function RSquare(R1, k) calculates the multiple coefficient of determination for the kth variable with respect to the other variables in R1. The multiple correlation coefficient for the kth variable with respect to the other variables in R1 can then be calculated by the formula =SQRT(RSquare(R1, k)).
Thus if R1, R2, and R3 are the three columns of the m × 3 data array or range R, with R1 and R2 containing the samples for the independent variables x and y and R3 containing the sample data for dependent variable z, then =MCORREL(R3, R1, R2) yields the same result as =SQRT(RSquare(R, 3)).
Similarly, the definition of the partial correlation coefficient (Definition 3) can be extended to more than three variables as described in Advanced Multiple Correlation.
Examples Workbook
Click here to download the Excel workbook with the examples described on this webpage.
References
Howell, D. C. (2010) Confidence intervals on effect size
https://www.uvm.edu/~statdhtx/methods8/Supplements/MISC/Confidence%20Intervals%20on%20Effect%20Size.pdf
Schmuller, J. (2009) Statistical analysis with Excel for dummies. Wiley
https://www.wiley.com/en-us/Statistical+Analysis+with+Excel+For+Dummies%2C+3rd+Edition-p-9781118464311
Data of 2 related variables of 20 data points
Sorry, but I don’t understand your comment.
Charles
How to solve 1 dependent variable and 3 independent variable
See https://www.real-statistics.com/multiple-regression/multiple-correlation-advanced/
Charles
Hi Charles!
Thanks for the great article, I wanted to ask how would you measure if the multiple correlation coefficient calculated is significant or not. For example, when working with two variable, it’s enough to get the p-value so we can know if the computed correlation is statistically significant, but since in this formula we’re already using the pairwise correlations between our variables, should we first make sure that all of those are significant (i.e. p-value > 0.05)?
Thanks!
Hello Matias,
This coefficient is calculated when using ordinary linear regression. The regression data analysis tool reports whether the value is significant or not (i.e. significantly different from zero).
Charles
Say there’s a collection of 1000 products in a particular category. And there are six different methodologies for ranking the desirability of each product, where each methodology produces ranks 1-1000, with room for ties within. Usually there is some general agreement amongst a majority of the methodologies, while one or two of them might widely disagree. My question is: How can I determine which ranking methodology is “most in agreement” with “most of the other” methodologies, for that particular product category? Which statistical approach would be appropriate for making such a determination? Thank you.
Perhaps the approach described at the following webpage is appropriate
https://www.real-statistics.com/reliability/interrater-reliability/kendalls-w/
Charles
Thank you. How would you go about isolating the winning methodology (“agrees the most with most of the others”)? Would you do multiple pair-wise runs and aggregate the W scores? Or is that too simplistic? (Or use the derived r correlation metric instead of W?)
Also is there a typo on that page for when W=0? “If all the Ri are the same (i.e. the raters are in complete agreement), then as we have seen, W = 0. In fact, it is always the case that 0 ≤ W ≤ 1. If W = 0 then there is no agreement among the raters.” (Observations section)
1. This approach doesn’t measure which methodology is best, only whether there is agreement. One approach that might be appropriate is to leave out one of the methodologies, one at a time, and compare which methodology results in the smaller W. You could also use a different approach entirely; e.g. ANOVA.
2. Yes, you are correct. There is a typo. It should read W = 1 instead of W = 0. I have now corrected this on the webpage. Thank you very much for catching this error.
Charles
real stats seems to have stopped working, i’ve tried to uninstall, even uninstalled and reinstalled office. not sure how to fix it at this point without uninstalling windows
Hello Everett,
I don’t have enough information to understand why it stopped working. That is unusual.
In any case, since you have uninstalled it, I suggest that you download a new copy of the Real Statistics software from the website. Then rename the file to ZRealStats.xlam and install it as described on the website.
Charles
ok. I had actually reinstalled everything. But what I discovered in trying to follow this instruction is that it’s only some components of the addin that are not working. In particular MCORREL is not working but some other functions as well. I can open the VBA code so it’s hard to see exactly where the problem is occurring.
yeah just was able to point at the different file and get RSquare function to work, but point at the new xlam doesn’t
Can you email me an Excel spreadsheet with the functions that you have found not to work, including the data and any error messages?
Charles
Hi Mr. Charles Zaiontz,
I am working on a study correlating two independent variables and one dependent variable. I referenced your theory about the triple correlation coefficient, but I am supposed to show proof of how we got to that formula. Would you be able to offer some clarifications on how to get to that formula from individual correlation coefficients? Thank you
Hi Ben,
If you are referring to Definition 1 of multiple correlation, it is a definition, and not a theorem or property, and so there is no proof.
There are properties about multiple correlation that will require a proof, but you need to state which property you have in mind.
It turns out that this definition yields the same results as the square root of the coefficient of determination from regression. (This is also the motivation behind Definition 1.) This assertion can be proved. In fact, if you follow the steps in the section on multiple regression, you will be able to create the proof.
Charles
Hi Mr. Charles,
How would I go about using the formula for the multiple correlation coefficient when I am trying to determine the correlation between 2 dependent variables and one independent since the formula presented above states its functionality only for 2 independent and 1 dependent.
Hi Max,
See https://www.researchgate.net/post/How_can_I_measure_the_relationship_between_one_independent_variable_and_two_or_more_dependent_variables2
Charles
Dear Charles,
I have this dataset based on measurements from the same individuals in three different specimens; in serum (blood) tissue and lung lavage. I wanted to check if serum could be a good surrogate marker for the immune response going on in the lungs and therefore performed the MCORREL on serum as z and the other two as x and y (independent variables). But I’m not entirely confident that this is allowed. It seems like the measurements have to be completely independent to be able to do this.
Can you advise on this?
Kind regards,
Fien
For each subject, the three measurements (serum tissue, lung lavage, immune response) don’t have to be independent. The subjects have to be independent of each other.
Charles
I wanted to know if there is a relationship between the variables Product Quality, Competitive Price, Accessibility, and Advertising Capability towards Customer Satisfaction what appropriate statistical tool should be used?
It depends on what you mean by relationship, but you could look into using multiple correlation. This is equivalent to performing regression with Customer Satisfaction as the dependent variable and the others as independent variables. The R-square (or R) value gives an indication of the size of the relationship (R = the multiple correlation coefficient). The regression coefficients provide an indication of the significance of each independent variable.
Charles
I intend to determine the correlation of instructional resource availability, adequacy and students performance. Pls which of the correlation should I use, and how would the result look like?
I can’t answer your question without more specific information. Are you trying to find the correlation between two variables or more than two variables? If more than two variables, are you looking for (1) the correlation between multiple independent variables and one dependent variable or (2) pairwise correlations between each pair of variables?
Charles
I am doing a study to find the relationship between students’ academic performance, aptitude, instruction, and environment. Which statistic can I use for analysis?
Hello,
There are many possible statistics that might be appropriate for such an analysis. Which statistic to use depends on the nature of the data and what you mean by “relationship”. One approach is to use multiple correlation or equivalently regression.
Charles
hi Charles,
I am doing a study to find the relationship amongst mindset, perceived stress and self-esteem. Which statistic can I use for analysis?
This depends on the details and your objective in the analysis. Possible analyses tools include: regression, ANOVA, correlation.
Charles
well I am trying to find correlation amongst these three. Which correlation can I use for three variables?
Hello, i hope you may enlighten me on this on.
We are aiming to study the correlation of sleepwear color to the sleeping pattern, what should we use to compute and analyze the data we will obtain?
Hello Ralph,
If sleepwear color and sleeping pattern take numeric values, then presumably you could calculate Pearson’s correlation coefficient, but the appropriate correlation depends on the nature of your data.
How are you measuring the sleepwear color? How are you measuring the sleeping pattern?
Charles
Hi,
I wanted know correlation between number of cases selected for PCR test, cases tested for positive and cases who got out of COVID 19 in a day where independent variable is cases who got out of COIVID 19 in a day. Could you please give me the detail.
Let x = # of cases selected for PCR test
Let y = # of cases that test positive (presumably via the PCR test)
Let z = # of cases who got out of covid-19
I presume that you mean that z is the dependent variable. Thus you calculate the multiple correlation coefficient R_z.xy as described on this webpage
Charles
Hey Charles,
I have a dataset containing household income, no. of store purchases and no. of web purchases made.
I want to find the correlation between income and choice of sales channel (store v/s web).
What is the best way to approach this?
I am not clear what you are looking for. What is the dependent variable and the independent variables?
Charles
hi,
I want to study the relationship between gender, stress levels and frequency of consumption of food groups. What is the best statistical method that can be used?
It depends on the details, but regression, ANOVA, correlation are typical approaches.
Charles
Dear Charles,
trying to calcolate Pearson’s coefficient with three variables, I came across your site. I would like to ask a question: in passing from the Pearson’s two-variables formula to the three-variables formula which mathematical steps have been made?
If the answer is too long, could you send me and email?
Thanks for your work and for your time.
Valentina.
Valentina,
All steps are described on this webpage. Do you have questions about the formula?
Charles
Really sorry Charles but I don’t understand the exact point on this webpage where from the two-variable formula you get the three-variable formula (the formula that appears first on this page I mean). Can you tell me?
Valentina,
I don’t explain further where the formula comes from. I use it as the definition of the multiple correlation coefficient.
It is the same correlation that is reported from the multiple linear regression analysis.
Charles
Hi Charles,
After calculating the pearson r correlation between three variables, how can I calculate a p-value? I am trying to test for high correlation between the variables (r > 0.75 and p-value < 0.05). So H0: r 0.75.
Most calculations of p-values (using t-test or Fischer z-transformation) seem intended for 2 variables and are based on H0: r = 0. Does the method change for 3 variables or for H0: r <= 0.75?
Thanks for your great site! It has been very helpful.
Chris,
First, note that the correlation between y and x1, x2 is equal to the correlation between y and y-pred. Here, y-pred is the forecasted value of y based on the regression of y on x1 and x2. This means that you can use the techniques for two variables (y and y-pred) to analyze three or more variables.
Charles
Hola Carlos, estoy tratando de demostrar que el coeficiente de correlación parcial entre X e Y, fijada Z, rXY.Z, es igual al coeficiente de correlación lineal entre los residuos ei y vi siendo ei los residuos de la regresión lineal simple entre Y y Z y vi los residuos de la regresión lineal simple entre X y Z. Lo pude comprobar numéricamente pero me gustaría hacer la demostración teórica. Si me puede indicar alguna “pista” para poder hacer la demostración, estaré muy agradecida.
Su aporte a la estadística es sublime.
Muchas gracias
Hello Susana,
Were you able to demonstrate that this was true for a simple example with say 10 values for (x, y, z)?
Charles
Yes, I demostrated that this is true for a few values X, Y, Z
Hello Susana,
Since you were able to demonstrate this for some values of X, Y and Z, the assertion is likely to be true, but I haven’t had the time to look into this further.
Charles
Thank you so much, I just wanted to ask about r2 if I got the R2= o.42, is this accepted?
I am not sure what you are referring to, but R-square = .331 based on the calculations right after Figure 2.
Charles
Hello Charles,
Thank you for the sharing the useful information on this website.
I have a question regarding how to calculate the fourth order correlation coefficients among four variables. If we have the variable x,y,z,and w.
Also for the case we have vectors or matrices.
I would appreciate if you can help me.
Hello Zara,
See Advanced Multiple Correlation
Charles
Thank you so much.
Is it logic, if the results of manually counting the multiple correlation coefficients, are slightly different from the results of SPSS calculations?
Hello Herlan,
I can’t think of any reason why the results for multiple correlation would be different between Real Statistics and SPSS.
Can you send me an example where there is a difference?
Charles
Hi,
For my research work , i am comparing one variable with 6 or 7 variables as you shown in Fig.2 how i could compile my result into one. How i could write my result. My results are in 0.8 or 0.9
Sorry, but I don’t understand your question.
Charles
This question isn’t specifically related to this. Here’s my question:
How can I find out the independent correlation of a confounding variable with Y:
I know that the correlation between 1 variable (X1) with Y is = 0.11, and that there’s a confounding variable (let’s call this variable X2), which has a correlation of 0.46 with X1. The only reason why X1 correlates with Y is because of the confounding influence with X2. How can I figure out what the independent correlation X2 (the confounding variable) has with Y? What is the correlation between X2 and Y then? There must be a way to know how to calculate this).
Hello Emil,
I don’t believe this is possible. E.g. here is a counter-example where knowing the correl(X1,Y) and correl(X1,X2) values doesn’t mean that you know correl(X2,Y).
Data sets A
X1 = 1, 3, 3.55542145030932
X2 = 3, 2, 3.50170050934321
Y = 1, 3, 4
Data sets B
X1 = 0.699565395107396, 2.7, 0
X2 = 3, 1.5, 4.5
Y = 2.5, 5.5, 3
You will see that although correl(X1,Y) is the same for both sets and correl(X1,X2) is the same for both sets, correl(X2,Y) is not the same for both sets.
Charles
Hello Charles,
I read both this article and the Advanced Multiple Correlation article, however I still cannot fully understand how to adapt the Definition 1(this article) formula in order to calculate the multiple correlation coefficient for 3 or more independent variables and 1 dependent variable.
Can you provide me with some explanation on how the formula would look for 3 or more independent variables?
Kind regards,
Martin
Martin,
I don’t know how you would expand the formula. The calculation with multiple independent variables generally uses matrices and so you could breakdown the matrix calculations to create a formula. I haven’t needed to do this since the approach described in the Advanced Multiple Correlation article works fine.
Charles