Basic Properties
Property 1: If x̄ is the mean of the sample S = {x1, x2, …, xn}, then the sample variance can be expressed by
![]()
Proof: Since
![]()
it follows that

Property 2: If µ is the mean of the population S = {x1, x2, …, xn}, then the population variance can be expressed by
![]()
Proof: Similar to the proof of Property 1.
Advanced Properties
Property 3: If the population {x1, x2, …, xn} has mean µx and standard deviation σx and the population {y1, y2, …, ym} has mean µy and standard deviation σy, then the variance of the combined population is
![]()
Thus if µx = µy the combined population variance would be
![]()
Property 4: If the sample {x1, x2, …, xn} has mean x̄ and standard deviation sx and the sample {y1, y2, …, ym} has mean ȳ and standard deviation sy, then the variance of the combined sample is
![]()
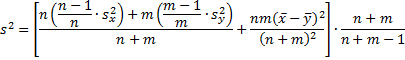
Thus if x̄ = ȳ, the combined sample variance would be
![]()
Proof: In general for a sample of size k, the sample variance can be calculated in the same way as the population variance of the same size, except that the result needs to be multiplied by k/(k – 1). Thus from the formula in Property 3, we get
from which the result follows easily.
Example
Example 1: Find the mean and variance of the sample which results from combining the two samples {3, 4, 6, 7} and {6, 1, 5}.

Figure 1 – Calculation of combined mean and standard deviation
The data in the two samples is given in the range B3:C7 of Figure 4. From these, the mean, variance, and standard deviation are calculated for each of the two samples (ranges B12:B15 and C12:C15). Using Property 4, we can calculate the mean and variance of the combined sample (D13 and D14).
If we simply combine the two samples we obtain the data in the range F3:F10, from which we can calculate the mean, variance, and standard deviation in the normal way (range D12:D18). As we can see the results are the same.
Examples Workbook
Click here to download the Excel workbook with the examples described on this webpage.
References
Bhandari, P. (2023) Variability | Calculating range, IQR, variance, standard deviation
https://www.scribbr.com/statistics/variability/
Soch, J. (2023) The book of statistical proofs
https://statproofbook.github.io/
Dr. Zaiontz,
Thank you, this has helped me so much. One thing I’d like to know is how I can calculate the standard deviation of multiple samples with different ns, mus, and sigmas. Property 4 shows how you can do it with 2 samples and I’m working with 51, and I could apply Property 4 50 times to combine all 51 samples, but I was wondering if there was a less cumbersome manner of doing this.
Thanks,
Cave
In my opinion the formulas for property 3 to have errors in the term:
n*var(X) + m*var(Y),
whereas the term should have been:
m*var(X) + n*var(Y),
given that x has m members and y has n members.
The same error of applying the wrong membership counts to X and Y exists in property 4 as well.
James,
You are correct. X should have n elements and Y should have m elements. I have now corrected the website. Thanks very much for catching this error.
Charles