Example 1: Find the linear regression coefficients for the data in range A1:E19 of Figure 1.
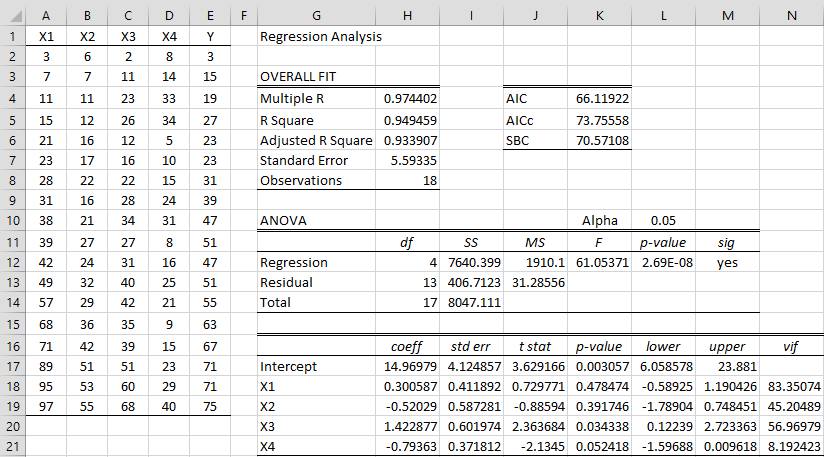
Figure 1 – OLS linear regression
We start by using the Multiple Linear Regression data analysis tool to calculate the OLS linear regression coefficients, as shown on the right side of Figure 1. Note that the standard error of each of the coefficients is quite high compared to the estimated value of the coefficient, which results in fairly wide confidence intervals.
Also note that VIF values for the first three independent variables are much bigger than 10, an indication of multicollinearity. This is confirmed by the correlation matrix displayed in Figure 2.
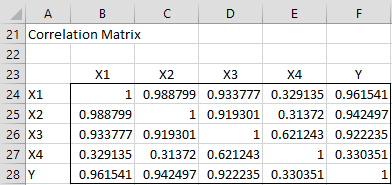
Figure 2 – Correlation matrix
We see that the correlation between X1 and X2 is close to 1, as are the correlations between X1 and X3 and X2 and X3.
We repeat the analysis using Ridge regression, taking an arbitrary value for lambda of .01 times n-1 where n = the number of sample elements; thus, λ = .17. First, we need to standardize all the data values, as shown in Figure 3.
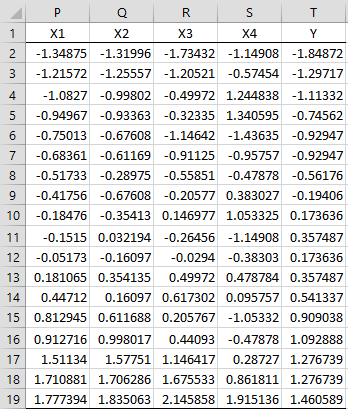
Figure 3 – Standardization of input data
The values in each column can be standardized using the STANDARDIZE function. E.g. range P2:P19 can be calculated by placing the following array formula in the range P6:P23 and pressing Ctrl-Shft-Enter:
=STANDARDIZE(A2:A19,AVERAGE(A2:A19),STDEV.S(A2:A19))
If you then highlight range P6:T23 and press Ctrl-R, you will get the desired result. Alternatively, you can place the Real Statistics array formula =STDCOL(A2:E19) in P2:T19, as described in Standardized Regression Coefficients.
To create the Ridge regression model for say lambda = .17, we first calculate the matrices XTX and (XTX + λI)–1, as shown in Figure 4.
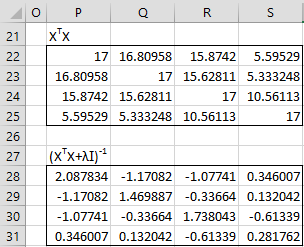
Figure 4 – Selected matrices
XTX in P22:S25 is calculated by the worksheet array formula =MMULT(TRANSPOSE(P2:S19),P2:S19), and in range P28:S31 by the array formula =MINVERSE(P22:S25+Z1*IDENTITY()) where cell Z1 contains the lambda value .17.
Next, we use the Multiple Linear Regression data analysis tool on the X data in range P6:S23 and Y data in T6:T23, turning the Include constant term (intercept) option off and directing the output to start at cell V1. Now make the following modifications:
Highlight the range W17:X20 and press the Delete key to remove the calculated regression coefficient and their standard errors.
Calculate the correct Ridge regression coefficients by placing the following array formula in the range W17:W20:
=MMULT(P28:S31,MMULT(TRANSPOSE(P2:S19),T2:T19))
Calculate the standard errors by placing the following array formula in range X17:X20:
=W7*SQRT(DIAG(MMULT(P28:S31,MMULT(P22:S25,P28:S31))))
We also modify the SSE value in cell X13 by the following array formula:
=SUMSQ(T2:T19-MMULT(P2:S19,W17:W20))+Z1*SUMSQ(W17:W20)
and place the formula =X14-X13 in cell X12.
Finally, we modify the VIF values by placing the following formula in range AC7:AC20:
=(W8-1)*DIAG(MMULT(P28:S31,MMULT(P22:S25,P28:S31)))
After all these modifications we get the results shown on the left side of Figure 5.
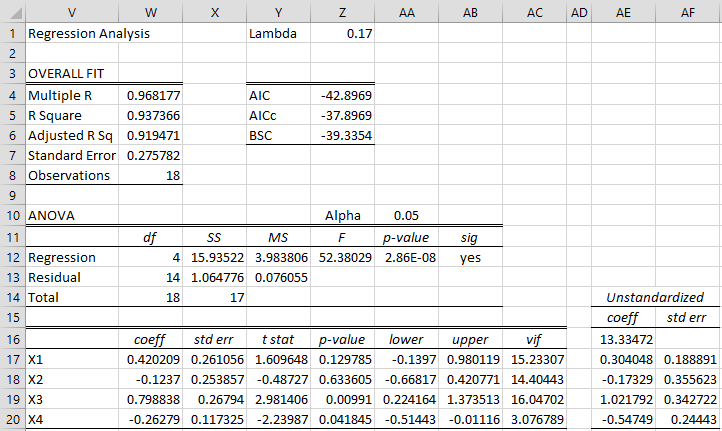
Figure 5 – Ridge Regression
The ordinary regression coefficients and their standard errors, as shown in range AE16:AF20, can be calculated from the standard regression coefficients using the array formula
=UnStdRegCoeff(A2:D19,E2:E19,W17:X20)
as described in Standardized Regression Coefficients.
Worksheet Functions
Real Statistics Functions: The Real Statistics Resource Pack provides the following functions that simplify some of the above calculations.
RidgeRegCoeff(Rx, Ry, lambda, std) – returns an array with standardized Ridge regression coefficients and their standard errors for the Ridge regression model based on the x values in Rx, y values in Ry, and designated lambda value. If std = TRUE, then the values in Rx and Ry have already been standardized; if std = FALSE (default) then the values have not been standardized. Note that the output contains two columns, one for the coefficients and the other for the corresponding standard errors, and the same number of rows as Rx has columns.
RidgeCoeff(Rx, Ry, lambda) – returns an array with unstandardized Ridge regression coefficients and their standard errors for the Ridge regression model based on the x values in Rx, y values in Ry, and designated lambda value. Note that the output contains two columns, one for the coefficients and the other for the corresponding standard errors, and the same number of rows as Rx has columns plus one (for the intercept). The values in Rx and Ry are not standardized.
RidgeVIF(Rx, lambda) – returns a column array with the VIF values using a Ridge regression model based on the x values in Rx and the designated lambda value. Note that the output will be the same whether or not the values in Rx have been standardized.
RidgeRSQ(Rx, Rc, std) – returns the R-square value for Ridge regression model based on the x values in Rx and standardized Ridge regression coefficients in Rc. If std = TRUE, then the values in Rx have already been standardized; if std = FALSE (default) then the values have not been standardized.
The array formula RidgeRegCoeff(A2:D19,E2:E19,.17) returns the values shown in W17:X20.
RidgeCoeff(A2:D19,E2:E19,.17) returns the values shown in AE16:AF20.
RidgeVIF(A2:D19,.17) returns the values shown in range AC17:AC20.
RidgeRSQ(A2:D19,W17:W20) returns the value shown in cell W5.
References
bquanttrading (2015) Ridge regression in Excel/VBA
https://asmquantmacro.com/2015/12/11/ridge-regression-in-excelvba/
Marquardt, D. W. and Snee, R. D. (1975) Ridge regression in practice. The American Statistician
https://typeset.io/papers/ridge-regression-in-practice-4esavyij1s
PennState (2018) Ridge regression. Applied Data Mining and Statistical Learning
https://online.stat.psu.edu/stat857/node/155/
Dear Dr. Charles Zaionts,
First of all, I want to thank you for having built Real Statistics Resource Pack and this blog. I believe they are helping a lot of people currently delving in the world of statistics, myself included.
Dr. Charles, if you don’t mind, I want to ask several things about Ridge regression & Real Statistics Resource Pack.
I have 10 sets of parameters (X) and 1 sets of observations (Y), with a total of 72 sample elements for each. It is quite unusual because most of the Xs can be the same for some samples, but the Ys for each samples are different (e.g. same parameters, different observation). For example, let’s say X1, X2, X3 for data 1, 2, 3 are the same, let’s say they’re all (a), (b), (c). However, the Y for data 1, 2, 3 are ultimately different, say (A), (B), (C). Here’s how they’d look in a table:
Y X1 X2 X3 … Xn
A a b c … …
B a b c … …
C a b c … …
I have installed the Real Statistics Resource Pack, and I have done a multiple linear regression analysis. Turns out that the VIF value is very high (one of the variables even reached 2200-ish). So I wanted to use Ridge regression as discussed in this post.
I noticed that in this post in the XTX step, while you use 18 sample elements, the diagonal number for the XTX matrix is 17. I assume that the diagonal number is always going to be n-1, n being the number of the sample elements. However, in my XTX matrix, the diagonal number is 72, which is the same as my n and not n-1 as shown in this guide.
I also had an error when using the =MINVERSE formula. Using the formula you wrote here, the calculation will result in a #NUM! error. What’s weird is that I can do the calculations if I just do the calculations directly using =((XTX Array) + λI)^-1. Is it possible that the formula cannot be used on my PC?
Thank you in advance, Dr. Charles. At the moment, I’m going to continue with the calculations as is.
Hello Ray and sorry for the delayed response to your comment.
Thanks for your support. I am pleased that you are getting value from Real Statistics.
Here are my specific responses to your comment:
1. “the diagonal number for the XTX matrix is 17” I assume that you are referring to the values on the main diagonal of the upper matrix in Figure 4. I would have to see your data to understand why you are getting a value different from the one that you are expecting. If you send me your data and results, I will try to figure out what is happening.
2. It seems unlikely that you would get a #NUM! error when using MINVERSE, although this possible for large matrices in Excel. I’ll check this out when you send me your data.
Charles