The one-sample Kolmogorov-Smirnov test is used to test whether a sample comes from a specific distribution. We can use this procedure to determine whether a sample comes from a population that is normally distributed (see Kolmogorov-Smirnov Test for Normality).
We now show how to modify the procedure to test whether a sample comes from an exponential distribution. Tests for other distributions are similar.
Example
Example 1: Determine whether the sample data in range B4:B18 of Figure 1 is distributed significantly different from an exponential distribution.
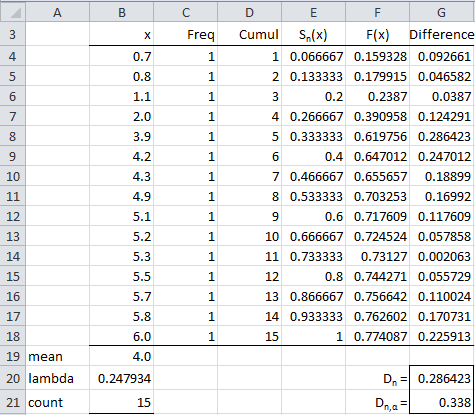
Figure 1 – Kolmogorov-Smirnov test for exponential distribution
The result is shown in Figure 1. This figure is very similar to Figure 3 of Kolmogorov-Smirnov Test for Normality. Assuming the null hypothesis holds and the data follows an exponential distribution, then the data in column F would contain the cumulative distribution values F(x) for every x in column B.
We use the Excel function EXPONDIST to calculate the exponential distribution valued F(x) in column F. E.g. the formula in cell F4 is =EXPONDIST(B4,$B$20,TRUE). Here B4 contains the x value (0.7 in this case) and B20 contains the value of lambda (λ) in the definition of the exponential distribution (Definition 1 of Exponential Distribution). As we can see from Figure 1 of Exponential Distribution, λ is simply the reciprocal of the population mean. As usual, we use the sample mean as an estimate of the population mean, and so the value in B20, which contains the formula =1/B19 where B19 contains the sample mean, is used as an estimate of λ.
All the other formulas are the same as described in Kolmogorov-Smirnov Test for Normality where the Kolmogorov-Smirnov test is used to test that data follows a normal distribution.
Results
We see that the test statistic D is .286423 (cell G20, which contains the formula =MAX(G4:G18)). We also see that D is less than the critical value of 0.338 (cell G21, which contains the formula =KSCRIT(B21,0.05), i.e. the value for n = 15 and α = .05 in the Kolmogorov-Smirnov Table). Since D < Dcrit, we conclude that there is no significant difference between the data and data coming from an exponential distribution (with λ = 0.247934).
We can compute an approximate p-value using the formula
KSPROB(G20,B21) = .141851
Caution
The one-sample KS Test works best when the parameters of the distribution being fit are known. When the parameters are estimated from the sample, then critical values need to be reduced. This is demonstrated in Lilliefors Test where a different table of critical values is used for fitting data to a normal distribution. If the distribution parameters need to be estimated from the sample, then you can use the One-sample Anderson-Darling Test for goodness-of-fit testing.
Examples Workbook
Click here to download the Excel workbook with the examples described on this webpage.
References
National Institute of Standards and Technology NIST (2021) Kolmogorov-Smirnov goodness-of-fit test
https://www.itl.nist.gov/div898/handbook/eda/section3/eda35g.htm
Wikipedia (2012) Kolmogorov-Smirnov test
https://en.wikipedia.org/wiki/Kolmogorov%E2%80%93Smirnov_test
This is really helpful. I am trying to find the critical value for one sample KS test (testing titled Laplace distribution fit) for annual change using monthly data so there is 11 month overlapping data involved. Is it possible to adjustment to the below critical value formula for 11 month overlapping data? my total data points are around 1000 monthly data points. (around 83 years)
D(n,alpha) = D(alpha)/(sqrt(n)+0.12+0.11/sqrt(n))
alpha=0.05, n=1000
Hello Manish,
If you know the parameter values of the Laplace distribution, then you can use the KS test as described on the Real Statistics website and software. If the parameter values are not known and need to be estimated from the data (the usual situation), then, unfortunately, the KS test for this distribution is not yet supported by Real Statistics.
You can use the approach described at
Puig, P. and Stephens, M. A. (2000) Tests of Fit for the Laplace Distribution, With Applications
https://www.researchgate.net/publication/240278042
I plan to add the Anderson-Darling version of this test to Real Statistics. In general, the Anderson-Darling test is better than the KS test.
Charles
Hello, Charles.
Is it possible to use the Kolmogorov-Smirnov single-sample test to check whether a sample is being sampled from Benford’s distribution?The critical values of the Kolmogorov-Smirnov test statistics are taken from https://en.wikipedia.org/wiki/Benford%27s_law
For α 0.10 1.012; for α 0.05 1.148; for α 0.01 1.420?
Thank you in advance for the answer!
Hello Konstantin,
Yes, perform the test in the usual way, except that you should use these critical values instead of the usual values from the critical value table.
Charles
Charles, Thank you!
Hello Konstantin,
I plan to add goodness-of-fit tests for Benford’s distribution (using chi-square, KS, and AD) to the next release of the Real Statistics software.
Charles
Hello Charles,
fan of your work. You’ve said for other distributions we follow the same procedure. But I’m stuck with Pareto_Dist. I need to to KS test for a Pareto fit (one data sample vs. theoretical pareto distribution). Can you post an example for Pareto distribution fitting as well?
Thanks in advance,
Hello Anil,
Suppose that you are testing the data in range B4:B18 of Figure 1 for a fit with a Pareto distribution with parameters alpha = 2.4 and mn = 1.9. We now place these two parameters in cells B20 and C20. We also need to modify the formulas in column F. E.g. the formula in cell F4 now becomes =PARETO_DIST(B4,B$20,C$20,TRUE).
This is the process to use if you already know the values of the two parameters. If not, then you need to estimate these parameters from the data. Two approaches are described on the Real Statistics website: method of moments and maximum likelihood estimate (MLE). These are described at
https://www.real-statistics.com/distribution-fitting/method-of-moments/method-of-moments-pareto-distribution/
https://www.real-statistics.com/distribution-fitting/distribution-fitting-via-maximum-likelihood/fitting-pareto-parameters-via-mle/
Note that the KS procedure is not as accurate when you estimate the parameters from the data. This is why for the normal distribution the usual KS method is replaced by a modified KS process (called Lilliefors method) when the normal parameters are estimated from the data.
Charles
wealth_2006_100 Freq Cumulative Sn(X) F(X) Difference
1800 1 1 0,0100 0,9332 0,9232
1506 1 2 0,0200 0,9085 0,8885
1501 1 3 0,0300 0,9079 0,8779
1474 1 4 0,0400 0,9049 0,8649
1454 1 5 0,0500 0,9026 0,8526
1395 1 6 0,0600 0,8952 0,8352
1380 1 7 0,0700 0,8932 0,8232
1360 1 8 0,0800 0,8904 0,8104
1310 1 9 0,0900 0,8829 0,7929
1250 1 10 0,1000 0,8727 0,7727
1228 1 11 0,1100 0,8687 0,7587
1200 1 12 0,1200 0,8632 0,7432
1150 1 13 0,1300 0,8525 0,7225
1145 1 14 0,1400 0,8513 0,7113
1100 1 15 0,1500 0,8404 0,6904
1100 1 16 0,1600 0,8404 0,6804
1100 1 17 0,1700 0,8404 0,6704
1075 1 18 0,1800 0,8338 0,6538
1060 1 19 0,1900 0,8296 0,6396
1050 1 20 0,2000 0,8267 0,6267
975 1 21 0,2100 0,8024 0,5924
950 1 22 0,2200 0,7931 0,5731
940 1 23 0,2300 0,7892 0,5592
925 1 24 0,2400 0,7831 0,5431
925 1 25 0,2500 0,7831 0,5331
910 1 26 0,2600 0,7768 0,5168
900 1 27 0,2700 0,7724 0,5024
900 1 28 0,2800 0,7724 0,4924
900 1 29 0,2900 0,7724 0,4824
875 1 30 0,3000 0,7607 0,4607
870 1 31 0,3100 0,7583 0,4483
850 1 32 0,3200 0,7481 0,4281
850 1 33 0,3300 0,7481 0,4181
820 1 34 0,3400 0,7316 0,3916
803 1 35 0,3500 0,7214 0,3714
770 1 36 0,3600 0,7000 0,3400
750 1 37 0,3700 0,6857 0,3157
750 1 38 0,3800 0,6857 0,3057
750 1 39 0,3900 0,6857 0,2957
725 1 40 0,4000 0,6662 0,2662
710 1 41 0,4100 0,6537 0,2437
700 1 42 0,4200 0,6448 0,2248
685 1 43 0,4300 0,6310 0,2010
685 1 44 0,4400 0,6310 0,1910
685 1 45 0,4500 0,6310 0,1810
675 1 46 0,4600 0,6212 0,1612
665 1 47 0,4700 0,6111 0,1411
660 1 48 0,4800 0,6059 0,1259
650 1 49 0,4900 0,5951 0,1051
650 1 50 0,5000 0,5951 0,0951
650 1 51 0,5100 0,5951 0,0851
650 1 52 0,5200 0,5951 0,0751
650 1 53 0,5300 0,5951 0,0651
640 1 54 0,5400 0,5838 0,0438
630 1 55 0,5500 0,5720 0,0220
620 1 56 0,5600 0,5598 -0,0002
620 1 57 0,5700 0,5598 -0,0102
615 1 58 0,5800 0,5534 -0,0266
605 1 59 0,5900 0,5403 -0,0497
600 1 60 0,6000 0,5335 -0,0665
590 1 61 0,6100 0,5194 -0,0906
575 1 62 0,6200 0,4970 -0,1230
550 1 63 0,6300 0,4558 -0,1742
550 1 64 0,6400 0,4558 -0,1842
550 1 65 0,6500 0,4558 -0,1942
545 1 66 0,6600 0,4469 -0,2131
525 1 67 0,6700 0,4091 -0,2609
520 1 68 0,6800 0,3990 -0,2810
510 1 69 0,6900 0,3780 -0,3120
500 1 70 0,7000 0,3558 -0,3442
500 1 71 0,7100 0,3558 -0,3542
500 1 72 0,7200 0,3558 -0,3642
500 1 73 0,7300 0,3558 -0,3742
500 1 74 0,7400 0,3558 -0,3842
485 1 75 0,7500 0,3201 -0,4299
480 1 76 0,7600 0,3075 -0,4525
480 1 77 0,7700 0,3075 -0,4625
465 1 78 0,7800 0,2675 -0,5125
460 1 79 0,7900 0,2533 -0,5367
455 1 80 0,8000 0,2388 -0,5612
450 1 81 0,8100 0,2237 -0,5863
450 1 82 0,8200 0,2237 -0,5963
450 1 83 0,8300 0,2237 -0,6063
450 1 84 0,8400 0,2237 -0,6163
450 1 85 0,8500 0,2237 -0,6263
436 1 86 0,8600 0,1791 -0,6809
435 1 87 0,8700 0,1757 -0,6943
435 1 88 0,8800 0,1757 -0,7043
435 1 89 0,8900 0,1757 -0,7143
435 1 90 0,9000 0,1757 -0,7243
425 1 91 0,9100 0,1411 -0,7689
420 1 92 0,9200 0,1229 -0,7971
400 1 93 0,9300 0,0438 -0,8862
400 1 94 0,9400 0,0438 -0,8962
400 1 95 0,9500 0,0438 -0,9062
400 1 96 0,9600 0,0438 -0,9162
400 1 97 0,9700 0,0438 -0,9262
400 1 98 0,9800 0,0438 -0,9362
400 1 99 0,9900 0,0438 -0,9462
390 1 100 1,0000 0,0000 -1,0000
mean 745 D= 0,9232
Dcrit= 0,1358
count 100
alpha 1,7698
This is what I’ve done. 390 is the minimum and estimated (from the data, by MLE, on a different sheet) alpha is 1,7697
The differences are too large though… Could it be because I need to invert F(X) order maybe?! Because Sn(x) increasing (obviously, cumulatively adding up to 1) but F(X) is decreasing to zero, hence differences go from very high positive to very high negative -1, always greater than the D_critical for KS. 🤔
Can you send me an Excel spreadsheet with this analysis?
Charles
Hi Charles,
I was trying to understand the Kolmogorov Smirnov test and came across your site and it really helps in understanding the concept. It would be great if you can explain, does KS test is sensitive to data normalization.
For example, if my dataset is lognormal then ln(x) transformed it to Normal.
Now, after this transformation, if the mean & std dev of my transformed data is not equal to (0,1) then will it make any difference?
I’m asking this question because I’m getting totally different p-values:
1. When the transformed data is standard scaled i.e. (mean, std dev) == (0,1)
In this case, the p-value is coming very low
2. Transformed data is not scaled i.e. (mean, std dev) != (0,1)
In this case, the p-value is coming high
Just a note here, I’m using python in place of excel and trying to understand whether it is one of the KS test concepts or the implementation difference.
Rajesh,
Data has a lognormal distribution when the natural log, ln x, of the data is normally distributed, but this does not mean that the result is standard normal with mean zero and standard deviation one.
If you email me an Excel file with your data and results illustrating points #1 and #2, I will try to figure out what is going on.
Charles
Thank you for sharing this information. it really helps. I really appreciate if you can answer these questions too:
1) if we are testing data against lognormal dist., why do you suggest to transform it to normal? there are formulas in Matlab for exp. that computes the theoretical CDF of X based on the parameters of the samples. I mean there isn’t any difference if we compare the empirical CDF with the lognormal CDF of the original data. is there?
2) Also, if you can explain the difference between two-sided and on0sided test of KS, I really appreciate it.
Hello Arash,
I am pleased that you find the Real Statistics website helpful.
1) You can certainly perform the KS test directly on lognormal data. If you estimate the mu and sigma parameters from the data, then you need to make sure that you use an equivalent of the Lillifours critical values. I didn’t provide all the various one-sample KS tests since the Anderson-Darling one sample test is a much better test.
2) See https://stats.stackexchange.com/questions/107668/does-it-make-sense-to-perform-a-one-tailed-kolmogorov-smirnov-test
Charles
Hi Charles,
If I want to test whether my set of data follows log-normal distribution, what is the best method to use? can I use KS method?
Thank you.
Hi Jessica,
Yes, you can use a KS test. If you are estimating the mu and sigma values from the sample data, then you should use the Lilliefors version of the KS test since the results will be more accurate. See Lilliefors Test
Since you are testing for log-normality you need to first transform your data via LN(x) (x is log-normal if ln(x) is normal).
A better test for log-normality is the one-sample Anderson-Darling test. See one-sample Anderson-Darling Test
Charles
Thank you for sharing your knowledge. If you do not mind, I have a question, can I use this method for two -sample KS test of similarity that have the same number of frequency (1). what is you suggestion if I change both function into exponential distribution as you did in the above example and find D and D crt and make decision whether the a pair of distributed values are similar or not?
Gebre,
I suggest that you try to do this and see what happens.
Charles
Charles,
Do you have a reference for hard-copy tables of the Kolmogorov-Smirnov One-Sample test for a Uniform distribution, N >50 ?
No Stephen, I don’t have such a reference.
Charles
hi Charles…
I would like to know the reference that you used to decide the score of Kolmogrov Smirnov for the level of significance (.05)
Wildan,
Are you asking for the reference to Kolmogorov-Smirnov table of critical values? If so, if you google you should find numerous references to the table of critical values.
Charles
I really not aware how to calculate s(x)
As described on the referenced webpage, please see the following webpage
Kolmogorov-Smirnov Test for Normality
Charles
Hi Charles,
I am wondering if a variable has good normality in KS test, can I use anova after?
Many thanks.
Tian
Tian,
In general I would recommend the Shapiro-Wilk test for normality rather than the KS test. If you do use the KS test then make sure that you use the Lilliefors version of the test if the mean and standard deviation are estimated from the sample.
If the test for normality holds then you can use Anova provided that the other assumptions hold (especially homogeneity of variances).
Charles
Hi sir
why can i only need to consider one side of the difference?
I mean only
abs(cumul/count-F(x))———–1
but not
abs(F(x)-(cumul-1)/n)————2
it makes more sense to me if D_n=max{1,2},since the step function is discontinuous at x
thx!
Leung,
Sorry, but I don’t quite understand what the other side of the difference is. In any case, the KS test is the one described. Perhaps there are other possible tests along the lines that you are describing.
Charles
Hi Charles, I guess what Leung tried to highlight is that Kolmogorov test statistic D_n considers sup_x|Fn(x)-F(x)|, which for computation purposes is translated into max_i{|F(x_i)-(i-1)/n|,|i/n-F(x_i)|}.
If the question simply tells you to test whether 2 variables follow a normal distribution, should I use the One-Sample K-S Test or rather consider the p-value of the Kolmogorov-Smirnov Test from the Tests of Normality (which in SPSS is given with the Lilliefors Significance Correction)?
Thanks in advance!
Steve,
In general I would use the Shapiro-Wilk test. It is more accurate.
If you are testing for a normal distribution with a specified mean and standard deviation then you could use the one-sample KS test. If you don’t know the population mean and standard deviation (and will estimate these from the sample), then you should use the Lilliefors version of the test.
Charles
Hi, Charles
I’m confuse how to calculate the value of Sn(x)?
Christian,
Sn(x) is explained on the following webpage
Charles
In your page ‘Kolmogorov-Smirnov Test for Normality’, the Sn(x)=k/n, if x(k) <= x < x(k+1). So what is the value of 'k'?
Hi Charles,
Regarding p-value, what is the difference between your formula KSPROB(D-statistic, Sample size) and KSDIST(D-statistic,Sample Size). On this page, the p-value is calculated using KSPROB. In the normality case, you used KSDIST. What is the difference. Thanks.
Jacky,
They both represent approximate values for the p-value. KSPROB(x,n) = the p-value estimated using the table of critical values. E.g., KSPROB(.24,30) = .05 because the critical value for alpha = .05 and n = 30 is .24. For values not in the table of critical values a harmonic interpolation is made: e.g. KSPROB(.23,30) = .0667; here .22 and .24 are in the table of critical values but .23 is not so a value between the two critical values is used.
The KSDIST(x,n) function uses a different approach, namely it calculates the p-value using an approximate Kolmogorov distribution function.
Neither value is perfect (nor are they always equal).
Charles
Don’t we able to one sample test on k-s test? like gamma distribution?
Sorry, but I don’t understand your question.
Charles
Hi
My research have two verible
avergae performance Cash F. (Before)….1
average performance Cash F. (After)…..2
Can I use KS to know if there are differnt to use before and After
You would typically use a paired t test or Wilcoxon signed ranks test for this sort of problem. A one sample KS test is typically used to see whether a sample fits a particular distribution.
Charles
Hi, sir
Since the null hypothesis for KS is that a set of data do not display a normal distribution, which means they are significantly different from each other.
If I just want to find out whether several figures, for instance, 1.1, 1.2, 1.4, 1.5, are significantly different from each other, only an one-sample KS test is OK?
Stacey,
A one-sample KS test can be used to determine whether a sample (such as the one you have listed) is normally distributed, i.e. that the sample is not significantly different from a normal distribution (not that the numbers in the sample are significantly different from each other). If you have the mean and standard deviation of the normal distribution, then you can use the KS test directly. If instead you are estimating the mean and standard deviation from the sample data, then you should use the Lilliefors version of the KS test, as described on the webpage
Lilliefors Test for Normality.
Charles
Thank you so much, Charles.
Your reply is really helpful. I also wanted to ask that if I want to estimate the difference within these five numbers (instead of their normal distribution) to find whether the difference is at a significant level, what kind of statistical test is suitable?
Thanks again.
Sorry, I did not make it clear.
These five numbers are means of five groups. I wanted to compare these five means to find whether data from these groups are significantly different.
Stacey,
You can use ANOVA. The input will be raw data for each group, not the means.
Charles
Thanks a lot. I wanna say your suggestion is really helpful. It is so kind.
I’ve read your introduction for an ANOVA test. Pardon me for another question. Five groups of raw data do not meet either the the normality assumption or homogeneity of variance test (their p value are all equal zero). However, the sample sizes are equal, with each group containing 5000 samples. Under this situation, an ANOVA test is OK?
Thanks a lot!
Thanks Charles.
Since the null hypothesis for KS is that they are not normally distributed, which means they are significantly different from each other. If I just want to compare several figures, for example, 1.31, 1.24, 1.56, 1.67, 1.45, to find out whether they are significantly different from each other, only an one-sample KS test is OK?
Hi,
I am trying to figure out how to use the K-S Test to evaluate the plausible randomness (or lack thereof) of a binary Heads-Tails sequence with n=200. It seems this should be possible with a minor tweak to what you present in these pages. Could you point me in the right direction?
Thanks,
Robert
Robert,
As described on the referenced webpage, the KS test can be used to determine whether a sample fits a particular distribution. For the case you have identified this distribution is a uniform distribution with endpoints 0 and 1.
Charles
Before doing one way ANOVA test, should we check the nomarlity of the population where the data were collected from by one sample KS, or check the normality of the the data itself by KS? In brief, should we do one sample KS or KS before we do one way ANOVA test???
Thanks for your reply. This question has bothered me for quite a long time.
The answer is yes. You should check normality before doing an ANOVA. However, note that ANOVA is pretty robust to violations of normality, provided the data is reasonably symmetric and the group samples are equal in size.
I provide a number of tests for normality on the website, and so I suggest you take a look at the webpage Testing for Normality and Symmetry. In particular, I would use either the Lilliefors test (which is related to the KS test) or the Shapiro-Wilk test for normality.
Charles
Thanks Charles
I spend a few hours to get Real Statistics Resource Pack to work on Excel 2007 dutch version
Hi Charles,
Nice article
I can’t find the function =KSCRIT(B21,0.05) in Excel.
I am using Excel 2007
Greetings
Afke
Afke,
KSCRIT is not a standard Excel function. You need to install the Real Statistics Resource Pack to use it.
Charles
Hi sir , why is two table for critical value of D (k-s test) , that in one table (α=0.05) and (n=25) ———–> D = 0.180 and in other table (α=0.05) and (n=25) D = 0.264 ????!!!!
for k-s test Normality i use this table ———–>
https://real-statistics.com/statistics-tables/kolmogorov-smirnov-table/
or this table ———–>
http://lya.fciencias.unam.mx/rfuentes/K-S_Lilliefors.pdf
thank you
excuse me for bad English
Hi Masoud,
The article that you reference explains that the table of critical values for KS are too high when the test is restricted to just the normal distribution. In fact for low values of n the values the authors calculated specifically for the normal distribution are about 2/3 of the general table values, which is consistent with .180 and .264. The table of critical values given in the Real Statistics website are for the general KS test.
This article seems to imply that if you want to use KS you should use critical values that are specifically calculated for the distribution you want to test (normal, uniform, exponential, etc.). In the case of the normal distribution I generally use the Shapiro-Wilk test which gives better results, and so I avoid this issue.
Charles
Hi Charles,
I’m a little confused about the KS table here. You chose α = .05 in this case, does it mean that there’s 95% chance that the distribution is not different from the expected distribution (exponential distribution in this case)? But why Dn,α goes smaller as the α increases? For example, in my case, D = 0.123 and n = 150. If I choose α = 0.05, Dn,α = 0.111 and I have to reject the null hypothesis, but if I choose α = 0.01, Dn,α = 0.133 and I can say my distribution is the same as expected. So what does α actually mean here and how should I choose it?
Thanks a lot!!
Chen
Chen,
The null hypothesis is that the two distributions are equal. The value of alpha is as described in Hypothesis Testing. Generally alpha is chosen to be .05, but you may choose a different value, based on how much error you can tolerate.
Charles
Hi
I have taken 22 different(softwares) samples of 2 different variables and first one contains 4 independent variables and second one contains 7 independent variables.In this situation can we apply ks test or which test can be applied in this situation?
Hi,
You need to specify what you are trying to test, before I can tell you which test to use.
If you are trying to compare two samples with different variables, then I would have to respond that this is like comparing apples with oranges.
Charles