Basic Concepts
The two-sample Kolmogorov-Smirnov test is used to test whether two samples come from the same distribution. The procedure is very similar to the One-Sample Kolmogorov-Smirnov Test (see also Kolmogorov-Smirnov Test for Normality).
Suppose that the first sample has size m with an observed cumulative distribution function of F(x) and that the second sample has size n with an observed cumulative distribution function of G(x). Define
![]()
The null hypothesis is H0: both samples come from a population with the same distribution. As for the Kolmogorov-Smirnov test for normality, we reject the null hypothesis (at significance level α) if Dm,n > Dm,n,α where Dm,n,α is the critical value.
For m and n sufficiently large
where c(α) = the inverse of the Kolmogorov distribution at α, which can be calculated in Excel as
Dm,n,α = KINV(α)*SQRT((m+n)/(m*n))
where KINV is defined in Kolmogorov Distribution. The values of c(α) are also the numerators of the last entries in the Kolmogorov-Smirnov Table.
Example (frequency table)
Example 1: Determine whether the two samples on the left side of Figure 1 come from the same distribution. The values in columns B and C are the frequencies of the values in column A.
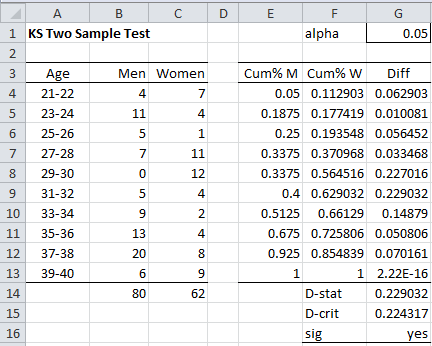
Figure 1 – Two-sample Kolmogorov-Smirnov test
We carry out the analysis on the right side of Figure 1. Column E contains the cumulative distribution for Men (based on column B), column F contains the cumulative distribution for Women, and column G contains the absolute value of the differences. E.g. cell E4 contains the formula =B4/B14, cell E5 contains the formula =B5/B14+E4 and cell G4 contains the formula =ABS(E4-F4).
Cell G14 contains the formula =MAX(G4:G13) for the test statistic and cell G15 contains the formula =KSINV(G1,B14,C14) for the critical value. Since D-stat =.229032 > .224317 = D-crit, we conclude there is a significant difference between the distributions for the samples.
We can also use the following functions to carry out the analysis.
Worksheet Functions
Real Statistics Functions: The following functions are provided in the Real Statistics Resource Pack:
KSDIST(x, n1, n2, b, iter) = the p-value of the two-sample Kolmogorov-Smirnov test at x (i.e. D-stat) for samples of size n1 and n2.
KSINV(p, n1, n2, b, iter0, iter) = the critical value for significance level p of the two-sample Kolmogorov-Smirnov test for samples of size n1 and n2.
iter = # of iterations used in calculating an infinite sum (default = 10) in KDIST and KINV, and iter0 (default = 40) = # of iterations used to calculate KINV.
When the argument b = TRUE (default) then an approximate value is used which works better for small values of n1 and n2. If b = FALSE then it is assumed that n1 and n2 are sufficiently large so that the approximation described previously can be used.
For Example 1, we have the following:
D-crit = KSINV(G1,B14,C14) = .224526
p-value = KSDIST(G14,B14,C14) = .043055
Observations
The following expresses the relationship between the KSDIST and KDIST worksheet functions and the KSINV and KINV functions (see Kolmogorov Distribution for the definitions of KDIST and KINV).
KSDIST(x, n1, n2, TRUE, iter) = 1–KDIST(x*(λ+0.12+0.11/λ), iter)
KSDIST(x, n1, n2, FALSE, iter) = 1–KDIST(x*λ, iter)
KSINV(p, n1, n2, TRUE, iter0, iter) = KINV(p, iter0, iter) / (λ+.12+.11/λ)
KSINV(p, n1, n2, FALSE, iter0, iter) = KINV(p, iter0, iter) / λ
where λ = the square root of n1 ⋅ n2 / (n1 + n2).
Table Lookup Functions
Alternatively, we can use the Two-Sample Kolmogorov-Smirnov Table of critical values to find the critical values or the following functions which are based on this table:
KS2CRIT(n1, n2, α, tails, interp) = the critical value of the two-sample Kolmogorov-Smirnov test for a sample of size n1 and n2 for the given value of alpha (default .05) and tails = 1 (one tail) or 2 (two tails, default) based on the table of critical values. If interp = TRUE (default) then harmonic interpolation is used; otherwise, linear interpolation is used.
KS2PROB(x, n1, n2, tails, interp, txt) = an approximate p-value for the two sample KS test for the Dn1,n2 value equal to x for samples of size n1 and n2, and tails = 1 (one tail) or 2 (two tails, default) based on a linear interpolation (if interp = FALSE) or harmonic interpolation (if interp = TRUE, default) of the values in the table of critical values, using iter number of iterations (default = 40).
Note that the values for α in the table of critical values range from .01 to .2 (for tails = 2) and .005 to .1 (for tails = 1). When txt = FALSE (default), if the p-value is less than .01 (tails = 2) or .005 (tails = 1) then the p-value is given as 0, and if the p-value is greater than .2 (tails = 2) or .1 (tails = 1) then the p-value is given as 1. When txt = TRUE, then the output takes the form “< .01”, “< .005”, “> .2” or “> .1”.
For Example 1, we have the following:
D-crit = KS2CRIT(B14,C14, G1) = .229792
p-value = KS2PROB(G14,B14,C14) = .051232
Test Function
Finally, we can use the following array function to perform the test.
KS2TEST(R1, R2, lab, alpha, b, iter0, iter) is an array function that outputs a column vector with the values D-stat, p-value, D-crit, n1, n2 from the two-sample KS test for the samples in ranges R1 and R2, where alpha is the significance level (default = .05) and b, iter0, and iter are as for KSINV.
If R2 is omitted (the default) then R1 is treated as a frequency table (e.g. range B4:C13 in Figure 1).
If lab = TRUE then an extra column of labels is included in the output; thus the output is a 5 × 2 range instead of a 1 × 5 range if lab = FALSE (default).
For Example 1, the formula =KS2TEST(B4:C13,,TRUE) inserted in range F21:G25 generates the output shown in Figure 2.
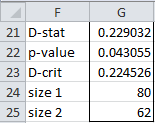
Figure 2 – Output from KS2TEST function
Example (raw data)
Example 2: Determine whether the samples for Italy and France in Figure 3 come from the same distribution.
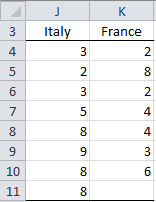
Figure 3 – Two data samples
We first show how to perform the KS test manually and then we will use the KS2TEST function.
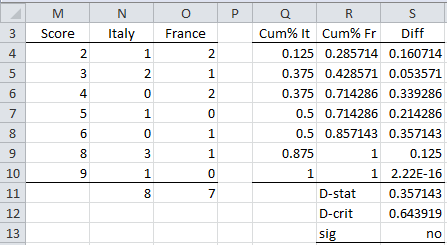
Figure 4 – Two sample KS test
The approach is to create a frequency table (range M3:O11 of Figure 4) similar to that found in range A3:C14 of Figure 1, and then use the same approach as was used in Example 1. This is done by using the Real Statistics array formula =SortUnique(J4:K11) in range M4:M10 and then inserting the formula =COUNTIF(J$4:J$11,$M4) in cell N4 and highlighting the range N4:O10 followed by Ctrl-R and Ctrl-D. Finally, the formulas =SUM(N4:N10) and =SUM(O4:O10) are inserted in cells N11 and O11.
We can also calculate the p-value using the formula =KSDIST(S11,N11,O11), getting the result of .62169.
We see from Figure 4 (or from p-value > .05), that the null hypothesis is not rejected, showing that there is no significant difference between the distribution for the two samples. The same result can be achieved using the array formula
=KS2TEST(J4:J11,K4:K10,TRUE)
which produces the output in Figure 5.
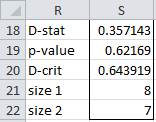
Figure 5 – Output from KS2TEST function
Finally, note that if we use the table lookup, then we get KS2CRIT(8,7,.05) = .714 and KS2PROB(.357143,8,7) = 1 (i.e. > .2).
Data Analysis Tool
Real Statistics’ Goodness of Fit data analysis tool also supports the Two-sample Kolmogorov-Smirnov Test. Click here for more information about this tool.
Examples Workbook
Click here to download the Excel workbook with the examples described on this webpage.
References
MIT (2006) Kolmogorov-Smirnov test. Statistics for applications
https://ocw.mit.edu/courses/18-443-statistics-for-applications-fall-2006/pages/lecture-notes/
Wessel, P. (2014) Critical values for the two-sample Kolmogorov-Smirnov test (2-sided), University Hawaii at Manoa (SOEST)
https://www.webdepot.umontreal.ca/Usagers/angers/MonDepotPublic/STT3500H10/Critical_KS.pdf
Dear Charles,
Thank you for the explanation, It is very useful.
can I use Dm,n,a =c(a)sqrt((m+n)/(m*n)) where m and n are equal say 12 to calculate the critical value? The constant value 96/144 is not working but the equation is working for me. so what is the difference?
Dear Chalachew,
If you are obtaining a constant value of 96/144, then I understand that you are looking for the critical value for alpha = .02 with m = n = 12.
What happens when you use the critical value of 96/144 (= 2/3)?
You can use the table of critical values resulting in the value of .6667, or the inverse of the distribution value, which should take a similar value.
Charles
Hi Charles,
I find Real Statistics extremely useful!
I have a question about the interpretation of alpha:
In the first example,
with alpha = 0.05 ==> D-crit = 0.22453
with alpha = 0.01 ==> D-crit = 0.26909
In other words, the lower the alpha, the greater the tolerated difference?
This seems counterintuitive.
Can you clarify?
Many thanks, Ricardo
Hi Ricardo,
Glad to see that you find Real Statistics useful.
If the test statistic D is larger than the critical value D-crit then you have a significant result. Since D-crit for alpha = .05 is greater than D-crit for alpha = .01, it is easier to obtain a significant result for alpha = .05 than for alpha = .01, just as you would expect.
For many other tests, you get a significant result when the test statistic is less than the critical value, which is probably why there is some confusion regrading this test.
Charles
Why is the abs difference of cum% x and y, where cum% x and y = 1, equal to 2.22E-16?
Here ABS(1-1) = 0, but due to roundoff errors in Excel the result is 2.22E-16 which almost zero. 2.22E-16 = .000000000000000222.
Charles
Hello Charles,
I am currently performing a 2-sample K-S test to evaluate the quality of a forecast I did based on a quantile regression.
The results were the following(done in python): KstestResult(statistic=0.7433862433862434, pvalue=4.976350050850248e-102).
After some research, I am honestly a little confused about how to interpret the results.
Really appreciate if you could help
Hello António,
The pvalue=4.976350050850248e-102 is written in Scientific notation where e-102 means 10^(-102). This is a very small value, close to zero. You may as well assume that p-value = 0, which is a significant result. THis means that there is a significant difference between the two distributions being tested.
Charles
Why does using KS2TEST give me a different D-stat value than using =MAX(difference column) for the test statistic?
KS2TEST gives me a higher d-stat value than any of the differences between cum% A and cum%B
The max difference is 0.117
but KS2TEST is telling me it is 0.3728 even though this can be found nowhere in the data
Ahh I just saw it was a mistake in my calculation, thanks!
Hi charles
I want to know when sample sizes are not equal (in case of the country) then which formulae i can use manually to find out D statistic / Critical value. Please clarify.
This is explained on this webpage. The calculations don’t assume that m and n are equal.
Charles
Hello Charles!
Can you please clarify the following: in KS two sample example on Figure 1, Dcrit in G15 cell uses B/C14 cells, which are not n1/n2 (they are both = 10) but total numbers of men/women used in the data (80 and 62). Is this correct? If so, in the basics formula I should use the actual number of raw values, not the number of bins? Thanks in advance for explanation!
Hello Oleg,
G15 contains the formula =KSINV(G1,B14,C14), which uses the Real Statistics KSINV function.
I don’t understand the rest of your comment. Can you please clarify?
Charles
Dear Charles,
Let me re frame my problem.
Taking m =2, I calculated the Poisson probabilities for x= 0, 1,2,3,4, and 5.
Now, for the same set of x, I calculate the probabilities using the Z formula that is Z = (x-m)/(m^0.5). Accordingly, I got the following 2 sets of probabilities:
Poisson approach : 0.135 0.271 0.271 0.18 0.09 0.053
Normal approach: 0.106 0.217 0.276 0.217 0.106 0.078
I am believing that the Normal probabilities so calculated are good approximation to the Poisson distribution. How can I test that both the distributions are comparable. can I use K-S test here?
See my response on June 29.
Charles
Taking m = 2 as the mean of Poisson distribution, I calculated the probability of
P(X=0), P(X=1)P(X=2),P(X=3),P(X=4),P(X >=5) shown as the Ist sample values (actually they are not). Next, taking Z = (X -m)/√m, again the probabilities of P(X=0), P(X=1 ), P(X=2), P(X=3), P(X=4), P(X >=5) are calculated using appropriate continuity corrections. Strictly, speaking they are not sample values but they are probabilities of Poisson and Approximated Normal distribution for selected 6 x values. Using K-S test statistic, D max can I test the comparability of the above two sets of probabilities?
Hello Ramnath,
I am not sure what you mean by testing “the comparability of the above two sets of probabilities”. You can use the KS2 test to compare two samples. If you assume that the probabilities that you calculated are samples, then you can use the KS2 test.
As shown at https://www.real-statistics.com/binomial-and-related-distributions/poisson-distribution/ Z = (X -m)/√m should give a good approximation to the Poisson distribution (for large enough samples).
Charles
Thank you for the nice article and good appropriate examples, especially that of frequency distribution.
If I have only probability distributions for two samples (not sample values) like
X value 1 2 3 4 5 6
1 st sample : 0.135 0.271 0.271 0.18 0.09 0.053
2nd sample: 0.106 0.217 0.276 0.217 0.106 0.078
How can I proceed. Can I still use K-S or not?
Hello Ramnath,
It seems like you have listed data for two samples, in which case, you could use the two K-S test, but…
1. When you say that you have distributions for the two samples, do you mean, for example, that for x = 1, f(x) = .135 for sample 1 and g(x) = .106 for sample 2?
2. What hypothesis are you trying to test? Are you trying to show that the samples come from the same distribution? If so, it seems that if h(x) = f(x) – g(x), then you are trying to test that h(x) is the zero function. In this case, probably a paired t-test is appropriate, or if the normality assumption is not met, the Wilcoxon signed-ranks test could be used.
Charles
I figured out answer to my previous query from the comments. If I understand correctly, for raw data where all the values are unique, KS2TEST creates a frequency table where there are 0 or 1 entries in each “bin”. I tried this out and got the same result (“raw data” vs “freq table”). So, here’s my follow-up question. Is this the most general expression of the KS test ? It seems to assume that the bins will be equally spaced. If your “bins” are derived from your raw data, and each bin has 0 or 1 members, this assumption will almost certainly be false. Perhaps this is an unavoidable shortcoming of the KS test.
Paul,
You should get the same values for the KS test when (a) your bins are the raw data or (b) your bins are aggregates of the raw data where each bin contains exactly the same values. In this case, the bin sizes won’t be the same.
If you don’t have this situation, then I would make the bin sizes equal. Even in this case, you won’t necessarily get the same KS test results since the start of the first bin will also be relevant. This is the same problem that you see with histograms.
Charles
Hi Charles,
Thank you for the helpful tools ! Both examples in this tutorial put the data in frequency tables (using the manual approach). Since the choice of bins is arbitrary, how does the KS2TEST function “know” how to bin the data ? Say in example 1 the age bins were in increments of 3 years, instead of 2 years. Would the results be the same ? If KS2TEST doesn’t bin the data, how does it work ?
Hi Charles, thank you so much for these complete tutorials about Kolmogorov-Smirnov tests.
I tried to implement in Python the two-samples test you explained here
epidata.it/PDF/H0_KS.pdf
Basically, D-crit critical value is the value of two-samples K-S inverse survival function (ISF) at alpha with N=(n*m)/(n+m), is that correct?
In Python, scipy.stats.kstwo just provides the ISF; computed D-crit is slightly different from yours, but maybe it’s due to different implementations of K-S ISF.
Max,
As stated on this webpage, the critical values are c(α)*SQRT((m+n)/(m*n))
I am not familiar with the Python implementation and so I am unable to say why there is a difference.
Charle
Hi Charles, thanks.
I got why they’re slightly different.
In Python, scipy.stats.kstwo (K-S distribution for two-samples) needs N parameter to be an integer, so the value N=(n*m)/(n+m) needs to be rounded and both D-crit (value of K-S distribution Inverse Survival Function at significance level alpha) and p-value (value of K-S distribution Survival Function at D-stat) are approximations.