Wilcoxon Signed-Ranks Test for Paired Samples
When the requirements for the t-test for two paired samples are not met, the Wilcoxon Signed-Rank Test for Paired Samples non-parametric test can often be used.
In particular, we assume there are n subjects from a given population, with two observations, xi and yi, for each subject i. This results in two paired samples {x1,…,xn} and {y1,…,yn} as described in Paired Sample t Test. The requirements for the Wilcoxon Signed-Rank Tests for Paired Samples where zi = yi – xi for all i = 1,…, n, are as follows:
-
- the zi are independent
- xi and yi are interval data (so that rankings can be applied and differences taken)
- the distribution of the zi is symmetric (or at least not very skewed)
If the second or third assumption is violated, then you should consider using the Sign Test, which doesn’t require symmetry.
For this test, we use the following null hypothesis:
H0: the distribution of the difference scores in the population is symmetric about zero
I.e. any differences are due to chance. We show how to apply this test via a couple of examples.
Example
Example 1: A researcher wanted to determine whether people’s ability to identify objects with their right eye differs from their ability with their left eye. 16 subjects were presented with a series of images, and they were scored on their ability to identify objects with each eye. The results are tabulated in Figure 1. Based on this data, use the Wilcoxon Signed-Ranks Test to determine whether there is a difference between the right and left eyes.
![]()
Figure 1 – Wilcoxon Signed-Ranks Test for Paired Samples
We perform a two-tailed Wilcoxon Signed-Ranks Test for Paired Samples with α = .05 to test the following null hypothesis:
H0: any difference between the two eyes is due to chance (essentially based on the median of the differences)
The scores for the two eyes are presented in columns B and C. Column D contains the differences between the scores for each subject. Column E contains the absolute value of these differences, eliminating any zero differences from further consideration. Next, column F contains the rankings of the non-zero values in column E (taking ties into consideration). Column G reports the values in column F where the difference in column D is positive. Column H reports the values in column F where the difference in column D is negative.
Finally, columns G and H are summed (in cells G19 and H19) to obtain T+ of 69.5 and T- of 35.5. The smaller of these values is the test statistic T = 35.5 (in cell K7).
Results
The critical value for the T statistic is provided in the Wilcoxon Signed-Ranks Table. Here we use α = .05 and n = 14 (i.e. the 15 subjects, less the 1 subject where the difference value in column D is zero). From the table, we find that Tcrit = 21 (two-tailed test). Since Tcrit = 21 < 35.5 = T, we can’t reject the null hypothesis (i.e. p ≥ .05), and so conclude there is no significant difference between the two eyes.
Normal Approximation
Generally, for n > 25, an estimate using the normal distribution can be made (as seen in the next example). The actual threshold of 25 is not universally accepted, and can be lowered to around 15 or raised to about 50.
Property 1: When n is sufficiently large, the T statistic (or even T+ or T-) has an approximately normal distribution N(μ, σ2) where
![]()
Click here for a proof of Property 1.
Correction for Ties
Property 2: If there are a large number of ties, a better estimate of the variance is given by
![]()
where t varies over the set of tied ranks and ft is the number of times (i.e. frequency) that the rank t appears.
Continuity Correction
It is often desirable to account for the fact that we are approximating a discrete distribution via a continuous one by applying a continuity correction. This is done by using a z-score of
![]()
instead of the same formula without the .5 continuity correction factor.
Example 2: A study was conducted to determine whether there is a difference between husbands’ and wives’ attitudes toward politics. A questionnaire measuring this was given to 30 couples, with the results summarized in range A3:C33 of Figure 2. Determine whether there is a significant difference between a couple’s attitudes towards politics (without using a ties or continuity correction).
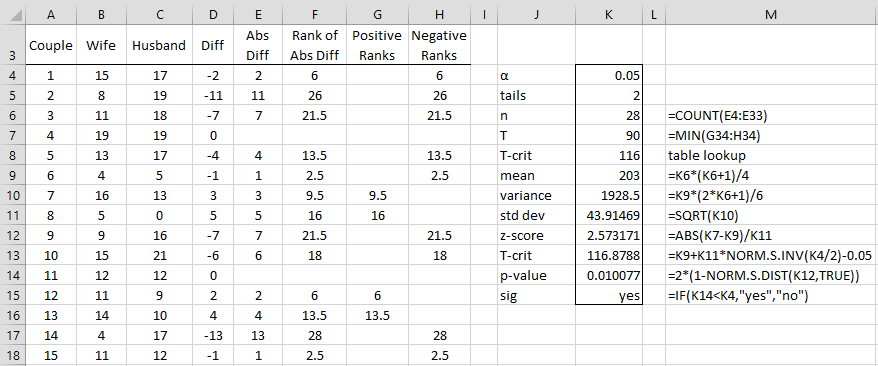
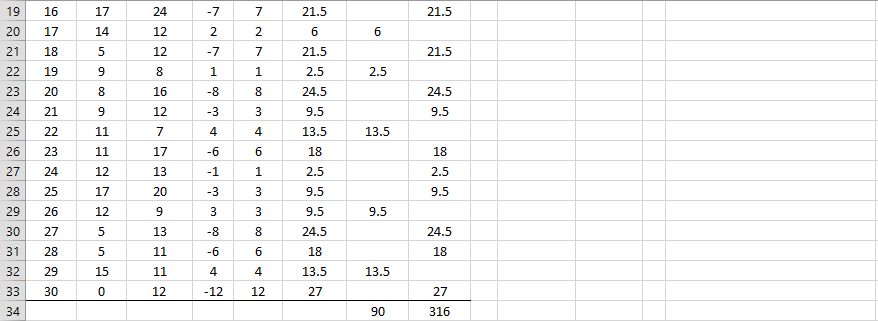
Figure 2 – Wilcoxon Signed-Ranks Test for Paired Samples
The figure is similar to that in Figure 1. Since T = 90 < 98 = Tcrit (two-tailed test), we conclude there is a significant difference between a husband and his wife’s attitude to politics.
Normal approximation
Alternatively, we can conduct the analysis using the normal distribution approximation, as we did in Example 2 of Mann-Whitney Test. This time, we calculate a mean of 203 (cell K9), a variance of 1928.5 (cell K10), and a standard deviation of 43.9 (cell K11). From these, we calculate a z-score of 2.57 (cell K12), which yields a p-value (cell K14) of .01 (two-tailed test), which is less than α = .05, and so, once again, we reject the null hypothesis. Note too that Tcrit = 116.8788 (cell K13), is based on the normal approximation and not a table lookup.
Worksheet Functions
Real Statistics Excel Functions: The Real Statistics Resource Pack provides the following functions:
SRANK(R1, R2) = T for a pair of samples contained in R1 and R2, where R1 and R2 each have only one column and the same number of elements.
SRTEST(R1, R2, tails, ties, cont) = p-value for the Signed-Ranks test using the normal distribution approximation for the pair of samples contained in R1 and R2, where R1 and R2 have only one column and the same number of elements. tails = 1 or 2 (default); if ties = TRUE (default) then a ties correction is used; if cont = TRUE (default) then a continuity correction is used.
There are also versions of SRANK and SRTEST that take only one array or range R1, which consists of two columns, one for each paired sample.
SRANK(R1) = T for a pair of samples contained in R1, where R1 consists of two columns, one for each paired sample.
SRTEST(R1,, tails, ties, cont) = p-value for the Signed-Ranks Test using the normal distribution approximation.
These functions ignore any empty or non-numeric cells.
Examples
In Example 2, SRANK(B4:C33) = 90, which is the same as the T value shown in cell K7 of Figure 2. The two-tailed p-value (assuming the normal approximation), shown in cell K14, can also be calculated by the formula SRTEST(B4:C33,2,FALSE,FALSE) = 0.010077. We can also use the two-argument versions of these functions, namely SRANK(B4:B33,C4:C33) and SRTEST(B4:B33, C4:C33,2,FALSE,FALSE).
Effect Size
As for the Mann-Whitney test for independent samples, we can use the correlation coefficient r as a measure of effect size, where
![]()
Unfortunately, there seems to be a number of conflicting ideas about what value should be used for n. Is n = the number of pairs or is it the number of observations (as for the effect size of the Mann-Whitney test), which is double the number of pairs? Also, do we include the eliminated pairs (namely, the cases where the difference between the pairs is zero) or not?
For Example 2, we have the following ways of calculating r
Here, .1 is a small effect, .3 is a medium effect, and .5 is considered to be a large effect.
Rank-serial correlation
Another estimate of the effect size is the rank-serial correlation, which is
![]()
where n is the number of observations excluding the cases where the difference is 0. For Example 2
![]()
which represents a large effect.
Since T+ + T– = C(n+1,2) and T = min(T+,T–) it follows that
![]()
where μ is the mean in the normal approximation.
Worksheet Array Function
Real Statistics Function: The Real Statistics Pack also provides the following array function for the samples in R1 and R2. The output includes three estimates of the p-value of the signed-ranks test, namely based on the normal approximation, the exact test, and the simulation test. We describe the last two of these tests at the end of this webpage.
SR_TEST(R1, R2, lab, tails, ties, cont, exact, iter, effect): returns the following values in a 6 × 1 column array: T-stat, z-stat, r effect size, and the three types of p-values. If ties = TRUE (default), the ties correction is applied. When cont = TRUE (default), then the continuity correction is applied. If lab = TRUE (default FALSE), then an extra column with labels is included in the output.
If exact = TRUE (default FALSE) or if the size of each sample is less than or equal to 500, then the p-value of the exact test is output, and if iter ≠ 0, then the p-value of the simulation version of the test is output, where the simulation consists of iter samples (default 10,000).
If effect = 0 then the rank-serial correlation effect size is used; otherwise, z/√k is used where if effect = 1 (default) then k = the # of pairs excluding ties, if effect = 2 then k = the # of pairs including ties, if effect = -1 then k = the # of observations including ties, and if effect = -2 then k = the # of observations including ties.
Once again, the R2 argument can be omitted if R1 contains two columns (one for each sample). The exact and simulation versions of the test are described subsequently.
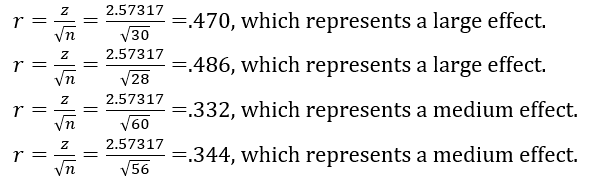
For Example 2, the array formula
=SR_TEST(B4:B33,C4:C33,TRUE,,FALSE,FALSE)
returns the array shown in Figure 3:
Figure 3 – Output from SR_TEST for paired samples
Data Analysis Tool
Real Statistics Data Analysis Tool: The Real Statistics Resource Pack also provides a data analysis tool that performs the Wilcoxon signed-ranks test for paired samples, automatically calculating the medians, t-test statistic, z-score, p-values, and effect size r.
For example, to use this data analysis tool for Example 2, press Ctrl-m and choose T Tests and Non-parametric Equivalents from the menu that is displayed (or from the Misc tab if using the Multipage user interface). A dialog box will appear as shown in Figure 3 in Mann-Whitney Test for Independent Samples. Enter B3:C33 in the Input Range, check Column headings included with data, choose the Paired samples and Non-parametric options, and make sure that all the Non-parametric test options are checked.
When you click on the OK button, the output shown in Figure 4 is displayed.
![]()
Figure 4 – Wilcoxon signed-ranks data analysis for paired samples
Note that rows 16 through 20 of the figure show the results of the Wilcoxon signed-ranks test using the normal approximation, while the bottom two rows show the p-values of the test using the exact test and simulation, respectively.
Ties and continuity corrections
Since the Use ties correction option is checked, the ties correction defined by Property 2 is applied in the calculation of the standard deviation (cell U17 of Figure 4) as follows.
=SQRT(U16*(2*U10+1)/6)-TiesCorrection(B4:B33,C4:C33,1)/48
where the TiesCorrection function is as described in Mann-Whitney Test.
Since the Use continuity correction option is checked, the 1/2 continuity correction is applied in the calculation of the z-score (cell U18) as follows:
=ABS(ABS(U13-U16)-1/2)/U17
Finally, note that the test ignores any data pairs where one or both of the values are non-numeric. The only exception to this is that the median values (U7 and V7 in Figure 4) are calculated separately, and so may include data that is not included in the test (since one of the elements in the pair is non-numeric).
Effect size
The effect size shown in cell U19 of Figure 4 is calculated by the formula =U18/SQRT(U10). If the Use rank-serial correlation option is checked on the dialog box, then the rank-serial correlation is used, and so cell U19 would contain the formula =1-U13/U16, with a value of .55665. In this case, cell V19 would contain the value “rank-serial”.
Wilcoxon Signed-Ranks Test for a Single Sample
We can also use the Wilcoxon Signed-Ranks Test to test the following single-sample null hypothesis:
H0: the median of the population is some given value v
We apply the Wilcoxon Signed-Ranks test for paired samples, as described above, where one sample is {x1,…,xn} and the second sample consists of n values all of which are v. The assumptions for this test are similar to those of the paired test, namely
- The xi are independent
- All the xi are interval data (so that ranking can be applied and differences taken)
- The distribution of the xi is symmetric (or at least not very skewed)
If the second or third assumption is violated, you should consider using the Sign Test.
Worksheet Functions
Real Statistics Excel Functions: The following functions are provided in the Real Statistics Pack:
SRANK(R1, med) = T for a single sample contained in R1 less med. If the second argument is omitted, it defaults to zero.
SRTEST(R1, med, tails) = p-value for the Signed-Ranks test using the normal distribution approximation for the sample contained in R1 less n. If the second argument is omitted, it defaults to zero. tails = # of tails: 1 (default) or 2.
These functions ignore any empty or non-numeric cells.
Example
Example 3: Determine whether the memory loss program described in Example 1 of the Sign Test is effective using a two-tailed Wilcoxon Signed-Ranks Test.
We repeat the data from this example in column B of Figure 5.

Figure 5 – Wilcoxon Signed-Ranks Test for a Single Sample
As shown in Figure 5, the memory data values are compared with the hypothetical median of 20%. We calculate T to be 40.5 (cell G3) using the formula SRANK(D4:D18) and find the critical value for T when n = 14 to be 21 (two-tailed test) from the Wilcoxon Signed-Ranks Table. Since 40.5 > 21, we cannot reject the null hypothesis and conclude once again that there is no significant difference between the median of the data and 20%.
Using the normal distribution approximation, we see that SRTEST(B4:B18,20) = SRTEST(D4:D18) = .225629 > .05 = α, and so again conclude there is no significant difference between the median of the data and 20% (one-tailed test).
Note that one way to calculate that n = 14 (cell G4) is to use the formula:
=COUNTIF(B4:B18,”<>”&20).
Worksheet Array Function
Real Statistics Function: The Real Statistics Pack also provides the following array function for the sample in R1 where med is the hypothesized median (default = 0). This function’s output includes three different estimates of the p-value of the signed-ranks test, namely based on the normal approximation, the exact test, and the simulation test. The last two tests will be described at the end of this webpage.
SR_TEST(R1, med, lab, tails, ties, cont, exact, iter, effect): returns the following values in a 6 × 1 column array: T-stat, z-stat, r effect size, and the three types of p-values. If ties = TRUE (default), the ties correction is applied. If cont = TRUE (default) then the continuity correction is applied. When lab = TRUE (default FALSE), then an extra column with labels is included in the output.
If exact = TRUE (default FALSE) or if the size of each sample is less than or equal to 500, then the p-value of the exact test is output, and if iter ≠ 0, then the p-value of the simulation version of the test is output, where the simulation consists of iter samples (default 10,000).
If effect = 0, then the rank-serial correlation effect size is used; otherwise, z/√n is used, where if effect = 1 (default), then n = the # of observations excluding ties, while if effect = 2, then n = the # of observations including ties.
For Example 3, the array formula =SR_TEST(B4:B18,C4,TRUE) returns the array displayed in Figure 6 (two-tailed test):
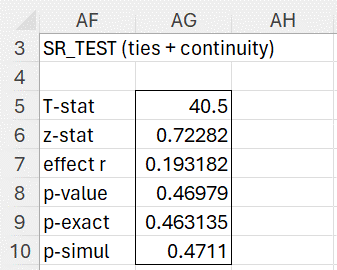
Figure 6 – Output from SR_TEST for a single sample
Data Analysis Tool
Real Statistics Data Analysis Tool: The Real Statistics Resource Pack also provides a data analysis tool that performs the one-sample Wilcoxon Signed-ranks test, automatically calculating the observed median, t-test statistic, z-score, p-values, and effect size r.
For example, to use this data analysis tool for Example 3, press Ctrl-m and choose T Tests and Non-parametric Equivalents from the menu that is displayed (or the Misc tab if using the MultiPage user interface). A dialog box will appear as in Figure 3 in Mann-Whitney Test for Independent Sample. Enter B3:B18 in the Input Range, check Column headings included with data, and enter 20 for the Hypothetical Mean/Mean. Next, select the Non-parametric and Single sample options and make sure that all the Non-parametric test options are checked.
When you click on the OK button, the output shown in Figure 7 is displayed.
![]()
Figure 7 – Wilcoxon Signed-Ranks analysis for a single sample
Note that rows 14 through 18 show the results of the Wilcoxon signed-ranks test using the normal approximation, while the bottom two rows show the p-values of the test using the exact test and simulation, respectively.
Ties and continuity corrections
Since the Use ties correction option is checked, the ties correction is applied in the calculation of the standard deviation (cell AB15) as follows.
=SQRT(AB14*(2*AB8+1)/6-TiesCorrection(B4:B18,AB6,0)/48)
where the TiesCorrection function is as described in Mann-Whitney Test.
Since the Use continuity correction option is checked, the 1/2 continuity correction is applied in the calculation of the z-score (cell AB16) as follows:
=ABS(ABS(AB11-AB14)-1/2)/AB15
Effect size
The effect size shown in cell AB17 of Figure 7 is calculated by the formula =AB16/SQRT(AB8). If the Use rank-serial correlation option is checked on the dialog box, then the rank-serial correlation is used, and so cell AB17 would contain the formula =1-AB11/AB14, with a value of .228571. In this case, cell AC17 would contain the value “rank-serial”.
Exact Test
Click here for a description of the exact version of the Signed Ranks Test using the permutation function.
Simulation
Click here for a description of how to use simulation to determine the p-value for the Signed-Ranks test. This approach takes ties into account.
Confidence Interval of the Median
Click here for a description of how to calculate a confidence interval of the median based on the Wilcoxon Signed Ranks Test.
Statistical Power and Sample Size
Click here for a description of how to calculate the power or minimum sample size of the Wilcoxon Signed Ranks Test.
Examples Workbook
Click here to download the Excel workbook with the examples described on this webpage.
Links
References
Wikipedia (2018) Wilcoxon signed-rank test
https://en.wikipedia.org/wiki/Wilcoxon_signed-rank_test
Howell, D. C. (2010) Statistical methods for psychology (7th ed.). Wadsworth, Cengage Learning.
https://labs.la.utexas.edu/gilden/files/2016/05/Statistics-Text.pdf
Stack Exchange (2017) Effect size to Wilcoxon signed rank test
https://stats.stackexchange.com/questions/133077/effect-size-to-wilcoxon-signed-rank-test
Kerby, D. S. (2014). The simple difference formula: an approach to teaching nonparametric correlation. Comprehensive Psychology.
https://journals.sagepub.com/doi/pdf/10.2466/11.IT.3.1
Hello Charles,
Great information on the Wilcox test. I have a question with regards to the population that I hope you could help me with.
I am comparing the frequencies of words in two corpora of different sizes. The standard protocol is to convert the frequency into relative/normalised frequencies with a common base value (per thousand words or per million words).
My question is should I use the raw frequency or relative frequency for this test?
I tried both and the results differ significantly. The one with relative frequency shows a significant difference between the two datasets (p >.05) and the p-value for one with raw frequency is 0.7796. I am super confused.
Many thanks in advance,
Jachee
Sorry, Just identified an error. I meant: The one with relative frequency shows a significant difference between the two datasets (p <.05)
Hello Jachee,
If you send me an Excel file with your data and test results, I will try to figure out what is going on.
Charles
Hi Charles,
I am wondering about the method used to calculate an Wilcox Signed-Ranks exact p-value when there are ties. Basically, I am trying to see how to replicate exact p-values from your method in R, which by default will throw an error when there are ties. Is this method analogous to the “mid-ranks” or “average-scores” methods in the R package coin? Or does it go by another name?
Thanks,
John
Hi John,
For more information about the exact test, see
https://www.real-statistics.com/non-parametric-tests/wilcoxon-signed-ranks-test/wilcoxon-signed-ranks-exact-test/
Yes, this approach is suspect if there are too many ties.
Charles
Hello,
This page has been really helpful.
Just one correction or confirmation. I believe
=SQRT(U16*(2*U10+1)/6)-TiesCorrection(B4:B33,C4:C33,1)/48
for ties corrected standard deviation is a wrong equation. It should be
=SQRT((U16*(2*U10+1)/6)-TiesCorrection(B4:B33,C4:C33,1)/48)
and
std dev=43.8449
I couldn’t get the values in Figure 4 by hand or by XRealStats, and figured that this equation gives me the same standard deviation, z-score, and p-value as XRealStats gives.
Please let me know if I am wrong.
Thanks!
Hi,
You are correct. I believe that I corrected this error sometime in the past, but when I opened the webpage I too found the error. When I purged cache the error disappeared.
Please let me know whether you still see the error. If so, purge cache and redisplay the page. Please let me know whether the error doesn’t go away.
Hi,
Unfortunately my data are set such that the data measurements are grouped by rows and not columns. (To compare between 2 rows and not 2 columns for example using SRTEST funct)
any chance I can somehow make the following code works SRTEST(column A1:column J10, column A2: column J2, 2, FALSE, FALSE) ?
If your data (in array R1) is grouped by rows instead of columns, you could just transpose your data by first using the formula =TRANSPOSE(R1). Alternatively, you could substitute TRANSPOSE(R1) inside the SRTEST formula and press Ctrl-Shft-Enter instead of Enter (since you now have an array formula).
Charles
Hi,
When you are completing the test using a one sided hypothesis, i.e. 1 tailed test, do you alter any of the excel calculations for the T-Crit and P-Value?
For example in example 2,
Thanks!
James
James,
Yes. In cell K14 you don’t multiply by 2 to calculate the p-value.
To find T-crit you double the alpha value as described at https://www.real-statistics.com/statistics-tables/wilcoxon-signed-ranks-table/
Charles
Hero! Thanks Charles
I have a question about Wilcoxon test when comparing difference between 2 paired subgroups and all the data in each group are no-normally distributed. If the sample size (n) is 28, higher than 25, is it correct to use normal distribution approximation instead?
Attached is the link where I found this kind of information. https://www.real-statistics.com/non-parametric-tests/wilcoxon-signed-ranks-test/
If the answer is yes, is it correct if I still use the Wilcoxon signed test?
If the answer is yes, why?
Junyu Chen,
Yes, you can use the normal approximation to the Wilcoxon signed-ranks test. This is the way the test works.
Charles
Charles,
I am likely overlooking something obvious but I am not understanding how you are generating numbers for Column F “Rank of Abs Diff” in your examples. In Example 1 you mention that these are “adjusted” rankings. Adjusted by what/how?
Thanks,
Richard
Richard,
They are adjusted for ties, and so the Excel function RANK.AVG is used instead of RANK.
Charles
Dear Charles,
By any chance, would you know whether (and if so, how much) tied ranks affect the extent to which the distribution of T approximates a normal distribution? I am especially worried about data where the number of non-equal pairs of observations is low (< 10) and there are many tied ranks? Is the normal approximation still appropriate in such a case? Sincere thanks in advance.
Sorry, but I don’t know how much ties affects this.
Charles
Dear Charles,
I have run Wilcoxon Signed-Rank Test for paired samples for 3 sets of my data. However, two of them showed p-normal as 0. The z-scores are the same as that of SPSS. Could you tell me what’s wrong with it? Thanks!
Hello Candy,
Perhaps nothing is wrong. The p-value can be zero. I would have to see your data to answer this definitely.
Charles
Charles,
I have emailed you the data. Hope you can help me to find out the cause. Really thanks for your help!
Hello Candy,
Thanks for sending me your data.
I ran the paired t test and signed ranks test on data set B and I see that the t test and signed ranks exact test both yield p-values that are extremely close to zero (5.8E-36 might as well be zero it is so small). The zero value is returned by Excel’s NORM.S.DIST function. Since the z value is almost 10 standard deviations from the mean, you should expect an extremely small p-value, which Excel seems to regard as sufficiently close to zero to be called zero.
Charles
Dear Charles,
Thanks. If the p-value is so small that excel showed p-value as 0, then SPSS might be a better analysis tool in this case? I am just interested in how small in value that the excel can detect in analysis.
Dear Candy,
There can many reasons for preferring SPSS to Excel, but I don’t think this is one of them. For most purposes, 0.001 is as small as needed. 5.8E-36 is 0.0000000000000000000000000000000000058.
Charles
Furthermore, how should I report the result in paper? Should I report as p-value <.001?
Hi Candy,
How to report the p-value depends on the journal or other publication. p-value < .001 or p-value << .001 could be appropriate. I would report it as highly significant with p-value = 0. Charles
Hi Charles,
I am having some problems with the assumption of symmetry for the WSR test and hope you can help.
I have a sample (N = 67) which includes sub-samples A (n = 30) and B (n = 37). I also have pre-test and post-test interval variables. My aim is to run a WSR test on each group using the pre-test and post-test variables.
The distribution of the differences between the pre-test and post-test variables for both group A and B are negatively skewed and unsymmetric. This would lead me to believe that the appropriate test is the Sign test.
However, I have also read elsewhere that “when the two sub-populations A and B from which the paired samples will be drawn (one each from 𝐴 and 𝐵) have the same (continuous) distribution, it is guaranteed that the pairwise differences between the samples will come from a continuous symmetric distribution” (see link below if what I provided is not enough).
https://stats.stackexchange.com/questions/348057/wilcoxon-signed-rank-symmetry-assumption
Given this and my data, am I able to run the WSR test or is the Signed test most appropriate.
Kind regards,
Kelly
Yes, if the two samples come from populations with the same distribution, then you can use the WSR test since the difference would be symmetric. The only problem is that you said that the difference is not symmetric.
Note that you can use bootstrapping or resampling instead of the sign test.
Charles
Hi Charles,
Could you explain the difference between the p-norm, p-exact and p-stimuli and when we would look at each one of these?
Thank you!
Sam
Sam,
This is explained on this webpage and the webpages whose links are given at the bottom of this webpage.
Charles
How to apply Wilcoxon rank sum test if our sample size is 36?
Hello,
With a sample this large, you can use the normal distribution approximation described later on this webpage.
Charles
Charles,
thanks for your detailed explanation. I have a dataset which includes the changes in operating performance for firms that go public on the stock market. One variable I am looking at is the sales figure of these companies. I want to compare the sales figure before the IPO with the figure after the IPO. However, I am only interested in the percentage changes of the sales figure. Does the Wilcoxon signed rank test work for percentage changes or only for absolute changes?
Furthermore, my sample consists of over 900 companies so I need to calculate the p-value by hand. Is the property of the mean (n*(n+1)/4) still valid when working with percentage changes?
Thank you very much in advance!
Paul
Hi Paul,
If you calculate the percentage change for each pair you will have a single sample whose values are the percentage change. Now you can perform a one sample Wilcoxon signed ranks test presumably for the median = 0%. You can use the standard approach to the one sample test.
Charles
I obtained the following results by using the Wilcoxon signed rank test. My sample size was 94. On average the participants’ score for the one measurement was 89.17 out of 120 (SD = 20.01) and their score for the other measurement was 100.84 out of 120 (SD = 12.26). The test indicated that a significant difference existed between the two scores measured in the study (z = -4.99, p<.05) with a large effect size as interpreted with Cohen’s criteria (r=-0.51).
I have now been asked to report the direction of my results. How do I go about doing that? Any help will be greatly appreciated.
Kind regards
Laetitia,
Since 100.84 > 89.17, the direction is that the second population is significant greater than the first population.
Charles
Hi Charles,
I have performed the Wilcoxen test, like shown in Table 4.
I do not understand how to decide whether the samples are shifted to the left or to the right?
Can I just compare the medians and if the first is smaller than the second I know that the samples are shifted the the right?
Thanks for your help.
Sebastian
Sebastian,
When comparing two independent samples using the Mann-Whitney test, you can create histograms of the two samples and see whether the plots look roughly similar (even if shifted right or left). If they are roughly similar, then the test can be used to compare the medians. In this case the medians determine whether one sample is shifted to right (or left) of the other.
Wilcoxon’s signed ranks test is used to compare paired samples (not independent sample) and essentially you are looking a one sample which contains the paired differences of the data from the two samples. The median of the difference (not the medians of each sample) will tell you whether the differences between the samples is shifted right or left (from the origin), but the Wilcoxon signed ranks test will tell you whether this shift away from zero is significant or just random.
Charles
Hi,
My data sets are matrices. I need to compare two matrices 43×43.
I’m getting an error message that macros aren’t compatible
I’m using Excel 2010, Windows 7 64 bit.
Kiran,
I don’t know why you are receiving this message. The usual reason for such a message is that the software wasn’t installed properly. If the software is installed correctly, when you press Alt-TI you should see RealStats and Solver on the list of add-ins with check marks next to them.
If not, you need to follow the installation instructions which can be found on the same webpage from where you downloaded the file containing the software.
Charles
Thank you for this, it’s brilliant. I have been trying to use the Wilcoxon signed ranks test for paired data, however, it is giving me 4.77117E-05 and 9.54233E-05 for a p-value – what should I do to get an actual value?
Kw,
These are the actual values written in scientific notation. 4.77117E-05 just means 4.77117 times 10 raised to the -5 power. This is the same as 0.0000477117. You can use Excel’s formatting capability to change this cell from Scientific format to General format.
Charles
Consider the following two datasets:
176;176;189;171;173;162;171
176;176;189;171;173;163;170
They are equal except for the last two values, where one value in row 1 is higher than the corresponding value in row 2, and one value is lower. There will only be two ranks: one positive (2) and one negative (-1). The T value will therefore be 1, which is less than the critical value of 2 and the test therefore shows that there is a significant difference between the datasets. They do however have the same mean value, so there should not be any difference between the means?
Am I doing something wrong here?
Correction: The ranks should be +1.5 and -1.5, but the problem still occurs.
Johan,
Yes, you are doing something wrong. The sample size is n = 2, which is too small to use the table of critical values.
If you use the normal approximation (not great either since the sample id very small), you will find that T = 1.5 (Wilcoxon Signed-Ranks Test for Paired Samples). Since mean for the normal approximation = 2*3/2 = 1.5, the z-score = (1.5-1.5)/s.e. = 0. Thus, for a two tailed test p-value = 1-NORMSDIST(0) = 1, and so there is no significant difference between the medians.
If you use the exact test, you will also get a p-value >> .05 (although the values reported are not correct, and so I need to fix these)
Charles
Thanks for the clarification!
Hi Charles
First of all, many thanks for creating this very useful tool.
I’m trying to perform a Wilcoxon Signed-Ranks for Paired Samples test using Real Statistics. The problem I keep having is that after inputting my data ranges (1 & 2) and otherwise completing the dialog box, I get the error “invalid input range 1 selected”. I’m quite certain I’m selecting only the data range I want. I get this error whether I choose the range with the column headings (and check the column heading box in the RealStats dialog) or not (and leave the corresponding box unchecked).
Any suggestions to get around this issue?
Again, thanks.
Eric
Eric,
I have just used the Wilcoxon Signed-Ranks test for Paired Samples and did not see this problem. Perhaps it has something to do with your data. If you send me an Excel file with your data, I will truy to figure out why you are having this problem. You can find my email address at Contact Us.
Charles
Sir Charles,
Thanks for this site, really helped me a lot as I’m really not a statistician! I hope you would consider my question. I have a paired sample data (n=229), and their differences are actually not symmetric (i.e. I even validated this using the D’Agostino-Pearson Test from your site as well). Considering the asymmetry, I should consider using the sign test but I am quite hesitant and am still trying to look for some way of still using the Wilcoxon-signed-rank test.
I read this dissertation of Mr. Jutharath Voraprateep about “Robustness of Wilcoxon Signed-Rank Test Against the Assumption of Symmetry”. If I was able to understand it correctly, he said that doing the Wilcoxon-signed-rank test after the Inverse transformation method from an arbitrary distribution of the dataset (in our case, the paired difference dataset) to comply the symmetry condition of the test can be done and may be considered.
However in my dataset, some paired difference are negative, and in that, I cannot use log/ln transformation. I still want to use Wilcoxon signed rank test instead of Sign test. Of this whole idea, I hope you could help me with my problems:
1. Is the inverse transformation method that sir Voraprateep said same with the simple transformation method (e.g log10(x), ln(-ln(x)), cube root(x) etc.)? If yes, I’ve been looking for a transformation method that can handle negative data and at the same time improve the symmetry of the data but up to now, I still can’t find one (I objectively test for symmetry of the transformed data using the same D’Agostino-Pearson Test for symmetry). I hope you have some suggestion on what specific transformation formula (dealing with negative values and asymmetric data) I could use/consider.
2. If it would be successful to transform the paired difference data and be able to follow symmetry, Can I use the result of the Wilcoxon Rank signed test for the transformed data to explain the actual paired difference data (i.e whether the changes/difference between the paired sample dataset is significant or not based from the result of the test from the transformed paired difference data).
3. If the whole idea is not appropriate, could you please suggest me of other tests similar to Wilcoxon or even sign test? Even if it’s hard, I’m going to study those tests.
I hope I was able to raise my questions/concern clearly and these questions were likewise able to provide further idea for other people who visits and really learn from your lectures and discussions. Thank you very much!
Larry,
While log(x) is not defined for negative values of x, log(a+x) is defined provided the constant a is chosen large enough so that it is bigger than the absolute value of the most negative value of x that you have in your sample. This approach might work for you.
Charles
What if you have all positive ranks, and no negative ranks? Do I use zero for my T since it’s the smaller of the sums (sum of the negative ranks), which makes it smaller than my T-crit (and statistically significant)? Thanks!
Cassie,
I think that is correct. Since all the signs go in one direction, you would expect that the result is significant.
Charles
How can We proof that Wilcox rank test is consistent
Please see the paper Mann & Whitney (1947) referenced in the Bibliography for the proof of the Mann-Whitney test. The proof is probably similar to that for the Signed Ranks test. If not, you could look at Wilcoxon’s original paper.
Charles
Hi Charles:
1. Can we work a Wilcoxon signed rank with unequal samples? For example:
n1=10 and n2=8
n1=20 and n2=5
n1=1 and n2=10
n1=1000 and n2=50
I saw in the example of husband and wife that the couple number 8 and 30 have a cero and a think we can but I have a doubt…
Felix,
The Wilcoxon signed rank test is for paired samples, and so there is essentially one sample consisting of pairs. Thus n1 must equal n2. If both members of the pair have the same value the value used by the test for that pair is zero.
Since n1 is not equal to n2 perhaps you are looking to use some other test — maybe the Mann-Whitney test (or even the t test).
Charles
Hi Charles,
Thank you for explaining the stats so nicely. Your website and RealStat package have been tremendously helpful.
I have one question, though. I ran the Wilcoxon signed rank test using the same dataset, and found SPSS puts out a negative Z value (-1.682), whereas RealStat in Excel puts out a positive Z value (1.631). Not only that, but the p values were slightly different: 0.093 in SPSS, and 0.1029 in RealStat. Would you please explain what can account for these differences in Z and P?
I would be very grateful to hear your opinion on this.
Thank you.
Sue,
The z value is probably negative, but I have used the absolute value of the z-value in Real Statistics since it is easier to relate to this value. In any case, the absolute values of z from SPSS should be equal to the z value from Real Statistics.
Without seeing the data, I can’t explain why the z values from Excel and SPSS should differ (except for the sign). The likely reason is how ties are handled (e.g. if SPSS automatically corrects for ties and you have not chosen the ties correction in Real Statistics). If you send me an Excel file with your data I will try to figure out why there is a difference.
The fact that the p-values are different is simply a consequence of the z values being different.
Charles
I was happy when I’ve found this great site but when I want to start Wilcoxon Signed-Ranks Test for Paired Samples (for 2007) a message pops up “alfa most be a number between 0 and .5”. Ofcourse the default value 0.05 is set. I don’t know if I’m doing something wrong or something with Excel is not right. I would be realy gratefull for answer about that error.
Cristopher,
Even though the default value is .05, you will need to re-enter the value (probably as ,05). You are receiving this message because the software is confused between .05 and ,05 (comma vs. period as the decimal indicator). I have tried to avoid this problem, but it seems to occur with Excel for certain languages.
Charles
I have two paired data on the perception of villagers regarding forest management before and after intervention of PFM. I see Wilcoxon is suitable to analyse the data to see if there is significant difference before and after intervention. Please could you provide me with reference of books that I can support my decision?
Thanks for your understanding.
Amani
Almost any book of statistics that includes nonparametric tests can be used as a reference. Two such references are:
Howell, D. C. (2010). Statistical methods for psychology (7th ed.). Wadsworth, Cengage Learning.
Moore, D., McCabe G. and Craig, B. (2006) Chapter 15 (Non-parametric tests) of Introduction to the practice of statistics, 6th Ed. WH Freeman
http://bcs.whfreeman.com/ips6e/content/cat_040/pdf/ips6e_chapter15.pdf
Charles
Dear Charles, I am testing for equality of means between large paired samples ranging in size from n=600-1400, with large and unequal variances. Is the Wilcoxon Signed-Ranks Test for Paired Samples suitable? [When I use the test the null hypothesis is consistently rejected, even when the sample means are very close]
Christo,
If your data is normally distributed (or at least not too skewed), you could even use the paired t test. Otherwise the Wilcoxon Signed-Ranks test could be used. Recall that in the paired test, the differences between each of the pairs is tests, and so the fact that the individual samples have different variances is not relevant.
With large samples, it is not too surprising that the null hypothesis is rejected, since even a small difference in the means will be statistically significant. In these cases (and even for small samples), you should calculate the effect size. If this statistic is small, you could conclude that there is a significant difference between the means, but that this difference is small.
Charles
Hi Charles
Thanks much for this well explained piece of information. I found it very useful as am preparing for my Non-Parametrics and Categorical Statistics.. but how do we compute the p value for the Wilcoxon?
Monica,
When the normal approximation is used then the p-value is simply NORMDIST(T,mean,std,TRUE) where T is the calculated T value and mean and std are the approximate mean and standard deviation values (as described on the referenced webpage).
Charles
Dear Charles,
I’m using the Data Analysis Tool for Wilcoxon signed-ranks test. However, when I select ties correction the standard deviation is negative and then impossible to calculate the others values.
I’m comparing the judgments of a same group of listeners, using a 5-point scale, concerning two different musical stimuli.
Thanks,
Juan
Juan,
Yes, I am seeing the same problem. There is a misplaced parenthesis in the program. I will fix this bug and put it in the next release, which should be available in the next couple of days.
Thanks very much for catching this error.
Charles
Hi Charles,
Just a question. Will there be a new release for Mac users soon ?
Thanks,
Juan
Hi Charles,
I performed Wilcoxon Signed Ranks test on two data sets using SPSS. In test statistics, it mentions the basis of the Z-value as either negative ranking or positive ranking. Can I use this logic to obtain an inequality between the two data set? Just like in a paired T-test, if the value of T is negative than we can say that the latter one in the data set is greater than the former one.
Thanks
Sorry, but I don’t understand your question. The Wilcoxon Signed-Ranks test is used as a substitute for the paired t test.
Charles
Hi Charles,
In SPSS, the test statistics is given in the form of Z and P value. With every Z-value it is indicated if it was based on positive ranking or negative ranking. While in the rank table it shows that Positive ranking indicates Sample1<Sample2 and vice versa. Can I use this to indication to infer the an inequality relation between the two samples?
Or simply, can this test be used to establish an inequality relation between the two samples?
Umer,
Sorry, but I don’t completely understand your question. In any case, the Wilcoxon Signed-Ranks test is used to establish an inequality relation between the two samples (assuming they are paired samples).
Charles
Hi Charles,
in Wilcoxon Single Sample Test which is the scale of effect r that i have to see? Cohen’s scale?
Best regards,
gp
No you shouldn’t use the Cohen’s scale.
A rough estimate of effect size is that r=.5 represents a large effect size (explains 25% of the variance), r=.3 represents a medium effect size (explains 9% of the variance), and r=.1 represents a small effect size (explains 1% of the variance).
Charles
Hi Charles,
sorry…..but where can I find references on the estimates that I have listed?
My problem is:
I have a distribution(X) on which I perform the Wilcoxon Signed-Rank Test for a Single Sample.
H0: X=0 ; H1: X != 0
The value of “effect r” is : 0,874474.
how can I interpret this value based on my hypothesis?
A rough estimate of effect size is that r = .5 represents a large effect size (explains 25% of the variance), r = .3 represents a medium effect size (explains 9% of the variance), and r = .1 represents a small effect size (explains 1% of the variance). Your value of r represents a very large effect. explaining over 76% of the variance.
Charles
In the PERMDIST(T, n, TRUE) formula, is T the value outputed above the sig(exact) in the table produced? So for figure 4, would it be PERMDIST(116, 30, TRUE)
Adam,
The value for T is 90, as shown in cell U13. Thus the calculation is PERMDIST(90, 30, TRUE).
Caution: since n = 30, this formula will take a while to calculate.
Charles
Great, thanks for your help.
I am wondering why I am getting different p values when I do this test in excel versus doing it in SAS. The p values are pretty different when using less than 20 observations, and SAS says “If n<20 , the significance of is computed from the exact distribution of S, where the distribution is a convolution of scaled binomial distributions."
The T criticial values are the same but p values of 2 tail are different.
When I use this excel add in, running the exact test and unchecking the exact test produce the same results. is that normal?
SAS: http://support.sas.com/documentation/cdl/en/procstat/63104/HTML/default/viewer.htm#procstat_univariate_sect029.htm
Ada,
When using the Real Statistics Wilcoxon Signed-Ranks data analysis tool both the one-tail and two-tail tests are shown using the normal approximation. This test outputs the T-crit, p-value and whether the test is significant or not. The result is the same whether the Include exact test option is checked or not.
If the Include exact test option is checked then in addition an exact test is displayed. This test shows the critical value based on the Wilcoxon Signed-Ranks Table and whether the T value is significant or not (no p-value is displayed).
In addition, you can conduct another version of the exact test using the PERMDIST(T, n, TRUE) formula (but not included in the data analysis tool). This version outputs a p-value, and may be equivalent to the output from SAS with n < 20 (I don't have a copy of SAS and so I can't check). I plan to update the website to make this clearer in the next day or two. Charles
Dear Charles,
I would like to do a Wilcoxon test to compare to sets of nonparametric paired data. I have downloaded the realstats package and activated it in the add-ins. When I open the data analysis window, the SRank options do not show. Am I missing something?
Many thanks for your help,
Sue
Sue,
SRank is a function and so you should enter it into a cell as you would the SUM, AVERAGE or other Excel functions
You can access the Wilcoxon Signed-Ranks Test, as described towards the end of the referenced webpage, as follows:
Press Ctrl-m and choose the T Tests and Non-parametric Equivalents data analysis tool from the menu that is displayed. On the dialog box that appears choose the One sample and Non-parametric options, and fill in the appropriate fields.
Charles
Hi Charles,
Thanks for your help.
Sue
Thank you for putting together this functions for excel.
I am trying to use the SRANK_TEST but it doesn’t returns the whole table that is supposed to return. What do you think I am missing? Once I place the function it returns T-Test on one single cell.
Fernando,
Based on your comment, I don’t understand the problem that you are having. If you send me the data set that you are testing, I will try to figure out what the problem is.
Charles
Is there a critical value table or calculator for large sample sizes? The two sample sizes I have is n1=75 and n2=171
Deon,
For large samples you should use the normal approximation described in Examples 2 and 3 of the referenced webpage. These examples use Property 1 described on that webpage.
Charles
which parametric test matches with wilcoxon test
The Wilcoxon signed ranks test for a single sample matches with the one-sample t test.
The Wilcoxon signed ranks test for paired samples with the paired samples t test.
Charles
Charles,
Can you double check your formula for calculating the effect size for the Wilcoxon Signs Rank Test?
This source uses N, whereas yours uses 2N:
http://www.let.rug.nl/~heeringa/statistics/stat03_2013/lect09.pdf
Thanks,
Gary
Gary,
In the reference N is the total number of observations on which z is based. I believe N = 2n where n = total number of paired samples since each pair has two observations.
Charles