Basic Concepts
Cohen’s kappa is a measure of the agreement between two raters who determine which category a finite number of subjects belong to, factoring out agreement due to chance. The two raters either agree in their rating (i.e. the category that a subject is assigned to) or they disagree; there are no degrees of disagreement (i.e. no weightings).
We illustrate the technique via the following example.
Example
Example 1: Two psychologists (judges) evaluate 50 patients as to whether they are psychotic, borderline, or neither. The results are summarized in Figure 1.

Figure 1 – Data for Example 1
We use Cohen’s kappa to measure the reliability of the diagnosis by measuring the agreement between the two judges, subtracting out agreement due to chance, as shown in Figure 2.

Figure 2 – Calculation of Cohen’s kappa
The diagnoses in agreement are located on the main diagonal of the table in Figure 1. Thus the percentage of agreement is 34/50 = 68%. But this figure includes agreement due to chance. E.g. Psychoses represents 16/50 = 32% of Judge 1’s diagnoses and 15/50 = 30% of Judge 2’s diagnoses. Thus 32% ∙ 30% = 9.6% of the agreement about this diagnosis is due to chance, i.e. 9.6% ∙ 50 = 4.8 of the cases. In a similar way, we see that 11.04 of the Borderline agreements and 2.42 of the Neither agreements are due to chance, which means that a total of 18.26 of the diagnoses are due to chance. Subtracting out the agreement due to chance, we get that there is agreement 49.6% of the time, where
![]()
Some key formulas in Figure 2 are shown in Figure 3.
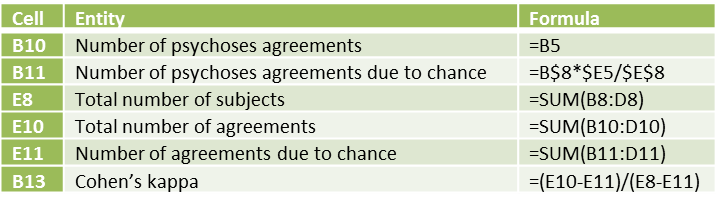 Figure 3 – Key formulas for worksheet in Figure 2
Definitions
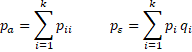
Definition 1: If pa = the proportion of observations in agreement and pε = the proportion in agreement due to chance, then Cohen’s kappa is
![]()
Alternatively,![]()
where n = number of subjects, na = number of agreements, and nε = number of agreements due to chance.
Another way to calculate Cohen’s kappa is illustrated in Figure 4, which recalculates kappa for Example 1.
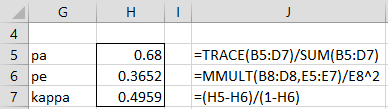
Figure 4 – Calculation of Cohen’s kappa
Properties
Property 1: 1 ≥ pa ≥ κ
Proof:
![]()
since 1 ≥ pa ≥ 0 and 1 ≥ pε ≥ 0. Thus 1 ≥ pa ≥ κ.
Observations
Note that
![]()
Thus, κ can take any negative value, although we are generally interested only in values of kappa between 0 and 1. Cohen’s kappa of 1 indicates perfect agreement between the raters and 0 indicates that any agreement is totally due to chance.
There isn’t clear-cut agreement on what constitutes good or poor levels of agreement based on Cohen’s kappa, although a common, although not always so useful, criteria are: less than 0% no agreement, 0-20% poor, 20-40% fair, 40-60% moderate, 60-80% good, 80% or higher very good.
A key assumption is that the judges act independently, an assumption that isn’t easy to satisfy completely in the real world.
Standard Error
Provided npa and n(1–pa) are large enough (usually > 5), κ is normally distributed with an estimated standard error calculated as follows.
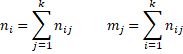
Let nij = the number of subjects for which rater A chooses category i and rater B chooses category j and pij = nij/n. Let ni = the number of subjects for which rater A chooses category i and mj = the number of subjects for which rater B chooses category j. Now define
![]()
Thus
The standard error is given by the formula
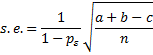
where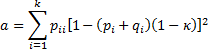
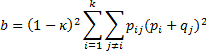
![]()
Standard Error Example
Example 2: Calculate the standard error for Cohen’s kappa of Example 1, and use this value to create a 95% confidence interval for kappa.
The calculation of the standard error is shown in Figure 5.
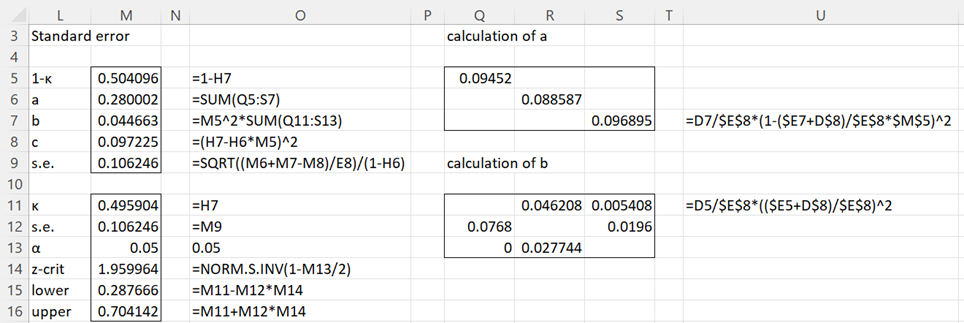
Figure 5 – Calculation of standard error and confidence interval
We see that the standard error of kappa is .10625 (cell M9), and so the 95% confidence interval for kappa is (.28767, .70414), as shown in cells O15 and O16.
When raters are not people
In Example 1, ratings were made by people. The raters could also be two different measurement instruments, as in the next example.
Example 3: A group of 50 college students are given a self-administered questionnaire and asked how often they have used recreational drugs in the past year: Often (more than 5 times), Seldom (1 to 4 times), and Never (0 times). On another occasion, the same group of students was asked the same question in an interview. The following table shows their responses. Determine how closely their answers agree.

Figure 6 – Data for Example 3
Since the figures are the same as in Example 1, once again kappa is .496.
Other Versions
Cohen’s kappa takes into account disagreement between the two raters, but not the degree of disagreement. This is especially relevant when the ratings are ordered (as they are in Example 2. A weighted version of Cohen’s kappa can be used to take the degree of disagreement into account. See Weighted Cohen’s Kappa for more details.
You can also use another modified version of Cohen’s kappa, called Fleiss’ kappa, where there are more than two raters. See Fleiss’ Kappa for more details.
Real Statistics Support
Real Statistics Function: The Real Statistics Resource Pack contains the following function:
WKAPPA(R1) = where R1 contains the observed data (formatted as in range B5:D7 of Figure 2).
Thus for Example 1, WKAPPA(B5:D7) = .496.
Actually, WKAPPA is an array function that also returns the standard error and confidence interval. This version of the function is described in Weighted Kappa. The full output from WKAPPA(B5:D7) is shown in range AB8:AB11 of Figure 7.
Real Statistics Data Analysis Tool: The Real Statistics Resource Pack provides the Interrater Reliability data analysis tool which can be used to calculate Cohen’s Kappa as well as a number of other interrater reliability metrics.
To calculate Cohen’s kappa for Example 1 press Ctrl-m and choose the Interrater Reliability option from the Corr tab of the Multipage interface as shown in Figure 2 of Real Statistics Support for Cronbach’s Alpha.
If using the original interface, then select the Reliability option from the main menu and then the Interrater Reliability option from the dialog box that appears as shown in Figure 3 of Real Statistics Support for Cronbach’s Alpha.
In either case, click on the OK button (or double-click on the Interrater Reliability option) in order to bring up the dialog box shown in Figure 7.
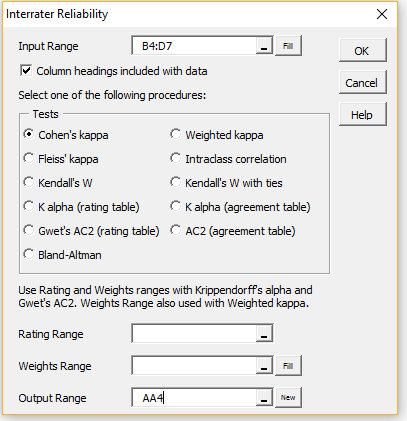
Figure 7 – Interrater Reliability dialog box
Fill in the dialog box as shown in the figure by inserting B4:D7 in the Input Range and choosing the Cohen’s kappa option. Upon clicking on the OK button, the output shown in Figure 8 is displayed.
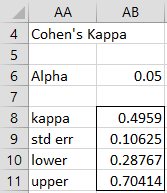
Figure 8 – Cohen’s Kappa data analysis
If you change the value of alpha in cell AB6, the values for the confidence interval (AB10:AB11) will change automatically.
Statistical Power and Sample Size
Click here for a description of how to determine the power and sample size for Cohen’s kappa in the case where there are two categories.
Examples Workbook
Click here to download the Excel workbook with the examples described on this webpage.
Reference
Wikipedia (2012) Cohen’s kappa
https://en.wikipedia.org/wiki/Cohen%27s_kappa
Widmann, M. (2020) Cohen’s Kappa: what it is, when to use it, how to avoid pitfalls. KNIME
https://www.knime.com/blog/cohens-kappa-an-overview#:~:text=Cohen’s%20kappa%20is%20a%20metric,performance%20of%20a%20classification%20model.
Hey, you made this easy for me to understand. I want to test interrater reliability of two raters who observed users of park across age and gender engaged in various activities. How do I enter this data in excel to check reliability using Cohen’s kappa?
To calculate Cohen’s kappa, you enter the data as shown in Figure 7.
Charles
Love this tutorial, but I think there’s a small error (at least my own Excel kappa calculator wouldn’t work until I fixed this). In Figure 3 – Key formulas for worksheet in Figure 2, for cell B11, shouldn’t the formula read B$8/E$8*$E5/$E$8? That would follow the text more accurately. Thank you!
Hi Suzanne,
Glad that you like the tutorial.
The formula that you have written is equivalent to B$8*$E5/$E$8^2. The spreadsheet uses B$8*$E5/$E$8 instead, with the value 16*15/50 = 4.8.
Charles
Hi Charles,
Would this be an apprpriate statistic to determine if 2 portable testing units demonstrate reliable value when compared to a control unit?
Hi Dan,
Cohen’s kappa can be used to compare two raters. If you have more than 3 raters, you need to use a different measurement. Fleiss’ Kappa, Gwet’s AC2, Krippendorff’s Alpha, ICC are possible approaches. All are described on this website.
Charles
Hello, Charles! As it is said on the page https://www.real-statistics.com/reliability/interrater-reliability/cohens-kappa/cohens-kappa-sample-size/ that
“The Statistical Power and Sample Size data analysis tool can also be used to calculate the power and/or sample size. To do this, press Ctr-m and select this data analysis tool from the Misc tab. On the dialog box that appears select the Cohen’s Kappa option and either the Power or Sample Size options”.
However, I couldn’t find the Cohen’s Kappa option under the “Statistical Power and Sample Size” option. Could you please tell me why? Maybe I did something wrongly? Thanks!
What version of Real Statistics are you using? To find this out, enter the formula =VER() in any cell.
Charles
Ah, I downloaded the version for 2007 Excel. Today, I have tried the newest edition. It works. Thank you for your information!
Congratulations. That is good to hear.
Charles
Dear Charles,
I’d like to estimate level of agreement for two diagnostic methods on child mortality. Each method has 11 likely causes of death. I have been able to estimate the Kappa for the methods but I’ll like to go further and estimate the Kappa for each disease outcome. For example like in your dataset above on psychosis, if you wanted to compute the Kappa for psychosis alone, and then compute for “borderline” separately, how would you go about it?
Dear George,
It depends on what you mean by agreement on each disease. One approach would be to compare a particular disease against all the others. E.g. suppose you want to calculate kappa for disease A. You repeat the kappa analysis except that you now only have two outcomes (instead of 11), namely disease A vs not disease A.
Charles
Hi Charles, thank you for this post. I THINK it’s what I need. I’m trying to find inter-rater reliability for grading case-control studies using the JBI Checklist for Case Control Studies. Two of us are rating a study, using “Yes”, “Unclear”, and “No” for 7 applicable questions. One rater rated all 7 questions as “yes”, and the other rater answered 5 “yes” and 2 “unclear.” I tried creating a table to mimic Example 1. I have 7 zeroes in my table, making this calculation seem impossible. I have a “#DIV/0!” error for my Kappa. Is there a better test for this when the answers aren’t varied?
Hi Michael,
You can use Gwet’s AC2 or Krippendorff’s alpha. Both are described on the Real Statistics website.
Charles
Hi,
I have 6 coders who are coding a subset of videos in a study and are doing so in pairs. So, not every video will be coded by more than coder and when the video is double coded, it is coded by a pair of coders, rather than all 6 coders. I have 1000 videos to code, so although it may be ideal to double code all videos, the is not feasible. I have numerous binary variables that are being coded (behavior present/absent) as well a continuous variable (decision time). What measurement do you suggest I use for inter-rater reliability?
Thank you!
I have a question, I need to compare 4 methods, scored on a scale of 1 to 5. Can I use Kappa’s statistics to calculate inter rater reliability. Do I do all possible comparisons or can the 4 be compared at once? Thanks in advance
If each method is considered to be a “rater” then you shouldn’t use Cohen’s kappa (or even the weighted version) since this is limited to two raters. You can use some other method, such as Krippendorff’s alpha or Gwet’s AC2. These are covered on the Real Statistics website.
Charles
Charles, you are awesome.
That is all.
🙂
Hi, Thank you for your explaination,
I have a question regarding the minimum number required to conduct the test ?
Best
Dear Alessa Hiba,
Cohen’s kappa is a measure of agreement between raters, it is not a test. There is no minimum needed to calculate Cohen’s kappa.
There is a test to determine whether Cohen’s kappa is zero or some other value. The minimum sample for this test is described at:
https://www.real-statistics.com/reliability/interrater-reliability/cohens-kappa/cohens-kappa-sample-size/
Charles
Hi Charles,
My study uses face and content validity and my instrument is 5-point likert scale. I am researching for analysis of a process flow in billing system with 3 sets of respondents. What reliability test would be better: inter- rater or cronbach alpha? Thank you and appreciate your reply.
Ricky,
It depends on what sort of reliability you are testing. If you want to see whether the respondents agree then use inter-rater reliability.
Charles
Dear,
I have calculated my kappa and its 95% confidence interval (which crosses +1 on the upper limit). I know that kappa has to be between -1 and +1.
How do I report this confidence interval?
Is it done to report a 95% CI that crosses +1? Is it even possible?
Thank you sincerely for your time!
Wes,
Round the upper limit down to +1.
Charles
Hi Charles! I have a very much similar case above, where my Std Error value is 0.215 and Kappa of 0.774, which would make the CI upper limit to go beyond +1 (1.1954 to be exact for 95% CI, 1.3287 for 99% CI) and you mentioned that to round it off to +1 : is there a particular reference you could point for this? Also, with these results, would you recommend/suggest to use 99% CI for reporting purposes?
Raj,
I would like to make sure that there isn’t an error in the Real Statistics calculation of the standard error which is causing the upper limit of the confidence interval to exceed 1, especially by such large amounts.
Can you email me an Excel file with your data so that I can check whether there is such a problem?
I am also considering using an alternative method for calculating the standard error that might give better results in any case.
Charles
Hello Charles,
I have to find the inter-evaluator reliability in my study.
The ratings given are in the form of student-performance scores by three evaluators.
The number of samples is 26.
I am unable to get the Cohen’s Kappa value using the inter rater reliability.
Could you please suggest, where I am going wrong in using real-statistics for this purpose or in my understanding?
What can I do here to check reliability?
Cohen’s kappa can only be used with two raters, not three. Which interrater reliability tool depends on the type of ratings being used (e.g. categorical, numeric). The Interrater Reliability webpage gives many choices. See
https://real-statistics.com/reliability/
Charles
Thank you!
Read about Cronbach’s alpha and looks like it is more appropriate.
Thanks for being there to show us direction.
Hi Charles,
Thank you for the well explained example.
I have been struggling with my specific example and finding a solution for it.
I would like to calculate a Cohen’s kappa to test agreement between 2 evaluators.
Each evaluator had 3 behaviours to identify (Elusive, Capture, School) and had to determine if each behaviour was present (0= Unidentifiable, 1 = Yes, 2 = No). The length of this data was 40 samples for each evaluator (total = 80 samples).
40 rows x 3 columns per evaluator.
Example data for evaluator 1:
Elusive Capture School
1 2 1
1 1 2
1 0 0
Example data for evaluator 2:
Elusive Capture School
1 2 1
1 2 2
1 0 1
My Questions:
(1) To use Cohen’s kappa with my example, would I have to calculate an individual Kappa for each behaviour (Thus splitting the data) then find an average?
(2) Is there a better method available than splitting and are any examples available?
(3) Would a different measure of agreement be more appropriate?
Many thanks,
Ghalia
Hello Ghalia,
I assume that for each evaluator you are displaying only the first 3 of 40 rows.
(1) Yes, as you have defined the problem, you would need to calculate an individual kappa for each of the 3 bahaviours. Whether you take the average or the max or some other approach, depends on what you will use the agreement statistic for.
(2, 3) You can use 3 x 3 x 3 = 27 categories (namely, 000, 001, 002, 010, 020, 011, 012, 021, 022, 100, 101, 102, 110, 120, 111, 112, 121, 122, 200, 201, 202, 210, 220, 211, 212, 221, 222. In this case, you would only calculate one kappa value. This will probably be more meaningful if a few of the categories are void. This approach is valid provided that there is no order to these 27 categories (or at least that you don’t care to take the order into account) since kappa is only used with categorical categories.
Charles
Hello Charles,
Thank you very much for the quick reply and clear explanation!
I have been able to do all the calculations but I have noticed that even few disagreements between evaluations (such as only 7 out of 40) pull the Kappa down to a moderate agreement. Is this due to the distribution and variability in disagreements or might there be another reason?
Again, thank you very much!
Ghalia
Hi Alex,
I want to test reliability of short answer test. There are ten test items.
In order to score it, scoring rubric will be used. The rubric has 3 criteria for each answer. 0 score if the answer is incorrect, 1 score if the answer is almost correct, 2 score if the answer is correct.
Since it is subjective test, there are two raters here. There are 80 students who will do the test.
Is Cohen’s kappa the right choice to test the reliability?
Hi Dee,
No, you can’t use Cohen’s kappa because there is an order to the rating and so they are not categorical. You can use weighted Coehn’s kappa, using the weights to capture the order of the ratings. Alternatively, you can use Krippendorf’s alpha or Gwet’s AC2, both of which are covered on the Real Statistics website.
Charles
Hi Charles,
I am considering using Cohen’s Kappa to test inter-rater reliability in identifying bird species based on photos and videos. However, based on what I’ve already done, there are nearly 50 bird species present already, meaning there would be at least 50 categories.
Is it possible to do a Cohen’s Kappa test with this many categories? Do you need a really big sample size? Would percentage agreement be more appropriate?
Alisa,
If each of the two raters must determine which of the 50 species a number of subjects belong to, then, yes you would need Cohen’s kappa with 50 categories. You don’t need a big sample to use Cohen’s kappa, but the confidence interval would be fairly wide unless the sample size is big enough. You could calculate the percentage of agreement, but that wouldn’t be Cohen’s kappa, and it is unclear how you would use this value.
Charles
Thank you for this resource.
I want to determine the reliability between two raters. They are making yes/no decisions on a variety of variables for a large number of participants. The data file I have has one row per participant; each pair of columns represents the coding decisions by Rater A and Rater B for a particular variable.
For illustration purposes, here is a (made up) example of a subset of the data where 1 = yes and 2 = no:
Rater A Rater B
Partipant #
1 2 1
2 2 2
3 1 1
4 1 2
5 1 1
As far as I can tell, this organization of the data does not allow me to use the Real Statistics Data Analysis Tool to calculate Cohen’s Kappa because the Tool expects to find the data in the format you describe in Figure 2. Is that correct?
Thank you.
Hello Richard,
If I correctly understand how you formatted your data, here is how you can use the Cohen’s kappa tool.
1. Suppose that your data is found in the range A1:C50. Use Real Statistics’ Chi-square Test for Independence data analysis tool (from the Misc tab) on the data in range B1:C50 (i.e. your data without the first column) and select the Standard Format option. If the first row in A1:C50 doesn’t contain column headings then also uncheck the Column/Row headings included in your data option.
2. You can ignore all the results from this tool except for the fact that this tool reformatted your data in the correct format for the Cohen’s kappa tool.
3. Choose the Cohen’s kappa option from the Interrater Reliability data analysis tool (from the Corr tab) and use the data formatted in step #2 as your input.
Charles
Hi Charles,
You understood me well and your solution worked perfectly. Thank you very much!
Thank you so much!!
Hi Charles,
First I would like to thank you for the huge work you carry out to make stats more accessible!
I have a question for you,
I would like to compare the images of two cameras, for which 25 persons have to describe a diagnosis (diagnosis n°1, 2, …, 8). The objective is to evaluate the concordance between the two images (are they conducting to the same diagnosis).
physician 1 physician 2 …. physician 25
Diagnosis for image 1 1 1 …. 1
Diagnosis for image 2 1 2 …. 1
Conducting to that contingency table
nb 1 nb2 nb3 nb4 nb5 nb6 nb7 nb8
nb 1 23 1 0 0 0 0 0 0
nb 2 1 0 0 0 0 0 0 0
nb 3 0 0 0 0 0 0 0 0
nb 4 0 0 0 0 0 0 0 0
nb 5 0 0 0 0 0 0 0 0
nb 6 0 0 0 0 0 0 0 0
nb 7 0 0 0 0 0 0 0 0
nb 8 0 0 0 0 0 0 0 0
As you can note, none of the physicians attribuate diagnosis N°3 to N°8 for any image. The concordance seems quasi perfect to me between the two types of camera.
However Cohen’s Kappa, is really bad k=-0.041666667
Maybe the choice of the test is wrong. Can you help me?
Many thanks in advance for any advice you can offer
Hello Charles,
Cohen’s kappa is only applicable when there are two raters. I presume that the doctors are the raters and so with 25 doctors you have more than 2 raters.
You need to use a different measurement. The possible choices are listed in the Interrater Reliability section on the following webpage. Gwet’s AC2 is usually a good choice, although Fleiss’s kappa is the multi-rater version of Cohen’s kappa.
Charles
Thank you for your quick answer!
By the way I used the 2 cameras as raters, diagnoses n°1 to 8 as categories and physicians as cases. The aim is to evaluate the concordance between cameras and not concordance between physicians.
To illustrate, if I use Fleiss kappa as you adviced me for 5 physicians in this example
nb 1 nb2 nb3 nb4 nb5 nb6 nb7 nb8
Image 1 5 0 0 0 0 0 0 0
Image 2 0 5 0 0 0 0 0 0
The Fleiss kappa will answer me kappa=1. Because physicians are perfectly agree that the diagnosis of image 1 is n°1 and that of image 2 is n°2. However the two camera does not conduct to the same diagnosis then I look for a test that show me no concordance.
Hope that the explanation of my issue maked sense to you…
Hello Charles,
Thanks for the clarification.
Yes, Cohen’s kappa often gives non-intuitive, and frankly misleading, results in extreme situations.
I suggest that you either (a) simply declare that there is perfect agreement (since this is obviously the case) or (b) use a different measurement: Gwet’s AC2 doesn’t have the limitations of Cohen’s kappa and in my experience gives more meaningful results.
Charles
Thank you for your help!
Sincerely, Charles
Hi! Thank you so much for this amazing resource! I am currently coding interviews with an additional coder. We are assigning codes to text segments of the interviews and have 49 codes to choose from. I would like to calculate ICR, but I’m finding it hard to figure out how to use Cohen’s Kappa as there aren’t any “yes” “no” codes to allow me to use nominal data in SPSS. I am using the coding software, Hyperresearch, which has an embedded ICR program. Would this program be robust enough to calculate ICR? Or, would you have a suggestion on how I could potentially proceed in SPSS?
Hello Ruan,
I don’t use SPSS and so I can’t offer any advice. This website is about using Excel for statistical analysis.
Charles
Hi Charles,
Thank you for your helpful resource. I conducted a study in which 2 evaluators evaluated 2 sets of surveys consisting of 25 sentences each with each question having 4 domains and rated it from 1-5. I am trying to do an inter rater reliability and was wondering if I could get some guidance on which inter rate reliability statistic should be used in my case. Any guidance will be greatly appreciated. Thank you!
Hello Addy,
Since ratings have an order Cohen’s kappa wouldn’t be appropriate. You could use ICC, Krippendorff’s alpha, Kendall’s W or Gwet’s AC2. I would probably choose Gwet’s. All of these are described on the Real Statistics website.
Charles
hi Sir, I am hoping that you will help me identify which inter-rater reliability should I use.
I am doing research on book content analysis. I have different sets of questions that I use in different categories. for example:
1. Whether a patient’s mole was
“normal”
“suspicious”
2. whether a person’s activity level should be considered
“sedentary”
“low”
“medium”
“high”
I have 14 sets of questions or cases with different categories. Is it okay for me to use Cohen even if I used different categories for every question? I hope u will help me sir
Hi Joe,
In order to answer your question I need some additional information, including:
1. How many raters are there? Put another way, how many people will be answering the questions?
2. When you say that you have 14 sets of questions, do you mean 14 questions or 14 different questionnaires each with some number of questions?
3. In the two examples that you have given the answers can be ordered (e.g. sedentary < low < medium < high). Is this true of all the questions? If not, can you give some examples of questions for which this is not the case? 4. What is your objective in using a measurement such as Cohen's kappa? Charles
Great info; appreciate your help. I have a 2 raters rating 10 encounters on a nominal scale (0-3). I intend to use Cohen’s Kappa to calculate inter-rater reliability. I also intend to calculate intra-rater reliability so have had each rater assess each of the 10 encounters twice. Therefore, each encounter has been rated by each evaluator twice. In calculating Cohen’s Kappa, should I pair each set of ratings and then average the kappas OR should I average the scores of each rater and then calculate Cohen’s Kappa (producing 1 kappa)? Thank you in advance.
Hello,
When you say that the ratings are 0-3, is there order to these ratings, namely 0 < 1 < 2 < 3. If so, you shouldn't use Cohen's kappa since it doesn't take the order into account. Better to use Gwet's AC2 or Krippendorff's Alpha. Regarding what to do with the multiple ratings, why would a subject change his/her rating? Charles
Dear all,
I have not used Kappa before. I am going to do an online survey and distributed to four raters. Could anyone help me hot to do the kappa agreement and other related items?
Regards
Hello Zakaryia,
With 4 raters you can’t use Cohen’s Kappa. Depending on the type of ratings, you could use Fleiss’s kappa, ICC, Gwet’s AC2, etc.
Charles
Hello,
I was wondering if you would be able to help me – I have 4 raters in total for a project, but only 2 raters coding per item. Due to the way the project has gone, it was not possible to split the data equally between all coders, so there is unequal overlap – for example coder A and coder B coded 50 articles together, while coder B and coder C overlapped for 5 articles. Would this be a problem for calculating kappa in this case? It is still only ever looking at disagreement between 2 coders, but I am not sure if the addition of extra raters affects calculations somehow. Based on some of the comments I’m wondering if should calculate separate kappas for each combination of coders and average together or provide the ranges? Any help or resources would be appreciated. Thanks!
Julia,
Fleiss’ kappa handles these sorrts of situations. See
https://real-statistics.com/reliability/fleiss-kappa/
Charles
Hello,
I see the Kappa indicate 0.496. But I can not see the assessment of that indicate. And I compare with AIAG MSA 4th, Kappa is greater than 0.75 indicate good to excellent agreement, & less than 0.4 indicate poor agreement. It means: no have standard from 0.4 to 0.75
So, Could you pls tell me how to assessment of the indicate 0.496?
Thank you!
Hello,
There is no common standard, but .496 is about .5 which is probably viewed as less than good.
Charles
It means: It can be acceptable but need to take improvement. Is this right?
And one more question, MSA attribute have indicate effectiveness, miss rate, false alarm and Kappa,… which indicate is the most important?
1. That it is acceptable is your interpretation. Some might agree with you, but others would say it is not acceptable.
2. Cohen’s kappa measures agreement, not importance.
Charles
Hello Charles
Sorry for my bad English, but I’m Brazilian and I do not know your language well.
Congratulations on the site is very interesting and to learn a lot.
I’m tempted to calculate the level of trust agreement for the following situation:
I have a sample of 50 pieces and 3 evaluators, each evaluator checks the same piece 3 times.
I would like to know the level of agreement among the evaluators, for example:
Appraiser A vs. Appraiser B
Appraiser A vs. Appraiser C
Evaluator B vs. Appraiser C
I do not know if I can be clear because I do not know the technical terms in English.
If you have not understood and you can send me an email so I can send you my spreadsheet, I thank you.
Thank you very much
What sort of ratings are given? E.g. are the ratings a number between 1 and 5?
Why does each evaluator check the same piece three times? Does this result in one rating or three ratings?
Charles
The pieces are sorted with 0 and 1, where zero (not go) and 1 (go).
Each evaluator checks the same piece 3 times as we are also testing a measuring device so we need to know if it is repetitive in its results.
Then we need to buy:
Evaluator A vs. Appraiser B
Evaluator A vs. Appraiser C
Evaluator B vs. Appraiser C
Appraiser A vs. Appraiser B vs. Appraiser C
In order to know if everyone realizes they agree on their evaluations.
Then we have to evaluate against the standard, to know if they are able to find the correct values.
Evaluator A vs. Standard
Evaluator B vs. Standard
C vs Standard Evaluator
Evaluator A vs. Appraiser B vs. Appraiser C vs. Standard
I was able to do the Kappa calculations, concordance, error rate and false alarm rate (that’s when a good part is detected as bad). but I could not manually calculate the confidence intervals.
Here are the results obtained via software:
Within the Evaluators Evaluation Agreement
Evaluator No. of Inspec. No. of Corresp. Percentage CI of 95%
1 50 42 84.00 (70.89, 92.83)
2 50 45 90.00 (78.19, 96.67)
3 50 40 80.00 (66.28; 89.97)
No. of Concordances: The evaluator agrees with the trials.
Statistics of Kappa de Fleiss
Evaluator Response Kappa EP of Kappa Z P (vs> 0)
1 0 0.760000 0.0816497 9,3081 0.0000
1 0.760000 0.0816497 9.3081 0.0000
2 0 0.845073 0.0816497 10.3500 0.0000
1 0.845073 0.0816497 10.3500 0.0000
3 0 0.702911 0.0816497 8.6089 0.0000
1 0.702911 0.0816497 8.6089 0.0000
My question is what the calculation CI of 95%
(70.89, 92.83)
(78.19, 96.67)
(66.28; 89.97)
Thank you very much for answering my question, and sorry if it got too long.
The manual calculation of the confidence interval for Fleiss’ kappa is shown on the following webpage:
https://real-statistics.com/reliability/fleiss-kappa/
Caution: Fleiss’s kappa is only useful for categorical rating categories. Also, this measurement may not be appropriate when you have more than one measurement per appraiser x subject.
Charles
Thank you very much
I was able to solve the problem.
I’ve learned a lot by reading your posts and it’s an excellent site.
Congratulations
Hi Charles.
I noticed that confidence intervals are not usually reported in research journals. Could you suggest some articles which indicate the need for CIs? Thanks.
This depends on your field of study.
Charles
Hi Charles
I have 3quastions.
1- I have 2 raters to rate on 3 tasks done by 5 subjects. The rater needs to score the ability of the subjects to perform the task either (2)-no mistakes, (1)-1 mistake and (0) more than 1 mistake. So should i use cohen cappa or weighted kappa?
2- For this kind of data, how should i perform the kappa analysis? Do i need to perform kappa testing for every tasks? If not, how can i do the analysis?
3- If let say i need to perform kappa analysis for every tasks and i get different kappa value for every tasks, can i mention the kappa value range for the 3 tasks?eg if kappa value for tasks 1 is 1, kappa value for task 2 is 0.8 and the kappa for tasks 3 is 0.9. Can I say the kappa value range from 0.7 to 1 for the tasks?
Hi Hani,
(1) Since there is an order involved, I would use weighted Cohen’s kappa to account for this order. Cohen’s kappa only handles two raters, but if you have more than two raters I would use Gwet’s AC2 or Krippendorff’s alpha, both of which are described on the Real Statistics website.
(2) See response to your previous comment
(3) Yes. You can also say that the average is .9, etc., etc.
Charles
i ask questions to children first about his daily activities , school activities , food eating, paints he suffer, etc
and each activity have 4 or 5 items
and we have 5 likrt scale
after that we ask same questions to child,s parents
so my question
if we want to check level of agreement btw parent and childer
answers can we use cohn Kappa agreement or normal pearson correlation
second question is we will check agreement between each item with in statements or we only check for all once for example for overall
dailly activity
thank yo
Adam,
In general, with two raters (in your case, the group of parents and the group of children) you can use Cohen’s kappa. However, there are two problems for your situation:
1. Cohen’s kappa is based on nominal ratings. This means that the order in a Likert scale is lost. Better to use another measurement: ICC, Gwet’s AC2, Krippendorff’s alpha. These are all described on the Real Statistics website.
2. All these measurements pertain to one measure at a time. It seems like you want to measure 4 or 5 items. This may be possible, but I would need to understand more of the details. In any case, you can create separate measurements for each of the 4 or 5 items.
Charles
Hi Charle,
I posted a comment. But, I couldn’t find it. Should I rewrite it again?
No. I have received it. You will see it displayed shortly.
Charles
Hi Charles.
Thnx for this helpful resource. In my case, I need to calculate Cohen’s kappa to assess inter-coder reliability. I have nominal data ( number of occurrences of subcategories and categories in a given corpus). Normally I should use 10% of the data to quantify it ( a second rater).
1) Should I re-calculate the frequency of occurrences of each subcategory and subcategory in the chosen 10% of data, so that I compare to the second rater’ coding ( frequencies) on that 10%?
2) If I calculate separate Kappas for each subcategory, How can I, then, calculate Cohen’s kappa for the category ( containing for example 3 sub-categories)? Should I do the sum of kappa values and divide them by the number of subcategories?
3) Do u have any links to a calculation of Cohen’s Kappa values for a similar case?
Please, forgive my ignorance and silly questions. Thnx for your time and effort in advance.
Salha,
I don’t know of a way to use Cohen’s kappa with subcategories. Perhaps it exists, but I am not familiar with it.
Charles
for instance there are two raters and they can assign yes or no to the 10 items and and one rater assigned yes to all items so can we apply cohen kappa to find out the agreement between the raters?
SJ,
You can use it, but you will likely get a Cohen’s kappa value of zero. In these sorts of situations the value is counter-intuitive (at least for my intuition). It might be better to use a different measurement (e.g. Gwet’s AC2, which is also described in the Real Statistics website).
Charles
I have 10 surgeons rating 40 images as intra or extra capsular fractures. Which kappa do i need to use to calculate their decision agreement? Hope this makes sense.
If there are two ratings, then you could use Fleiss’s Kappa.
Charles