Introduction
Cohen’s Kappa is a measure of the agreement between two raters, where agreement due to chance is factored out. We now extend Cohen’s kappa to the case where the number of raters can be more than two. This extension is called Fleiss’ kappa. As for Cohen’s kappa, no weightings are used and the categories are considered to be unordered.
Formulas
Let n = the number of subjects, k = the number of evaluation categories, and m = the number of judges for each subject. E.g. for Example 1 of Cohen’s Kappa, n = 50, k = 3 and m = 2. While for Cohen’s kappa both judges evaluate every subject, in the case of Fleiss’ kappa, there may be many more than m judges, and not every judge needs to evaluate each subject; what is important is that each subject is evaluated m times.
For every subject i = 1, 2, …, n and evaluation categories j = 1, 2, …, k, let xij = the number of judges that assign category j to subject i. Thus
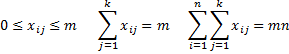
The proportion of pairs of judges that agree in their evaluation of subject i is given by
![]()
The mean of the pi is therefore
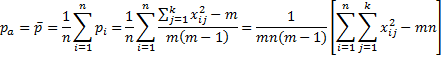
We use the following measure for the error term
 where
where

Fleiss’ Kappa and Standard Error
Definition 1: Fleiss’ Kappa is defined to be
![]()
We can also define kappa for the jth category by
![]()
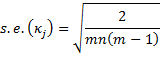
The standard error for κj is given by the formula
 The standard error for κ is given by the formula
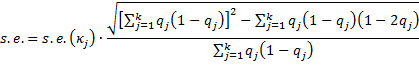
There is an alternative calculation of the standard error provided in Fleiss’ original paper, namely the square root of the following:
The test statistics zj = κj/s.e.(κj) and z = κ/s.e. are generally approximated by a standard normal distribution. This allows us to calculate a p-value and confidence intervals. E.g. the 1 – α confidence interval for kappa is therefore approximated as
κ ± NORM.S.INV(1 – α/2) * s.e.
Example
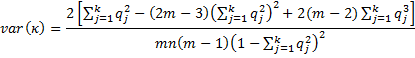
Example 1: Six psychologists (judges) evaluate 12 patients as to whether they are psychotic, borderline, bipolar, or none of these. The ratings are summarized in range A3:E15 of Figure 1. Determine the overall agreement between the psychologists, subtracting out agreement due to chance, using Fleiss’ kappa. Also, find Fleiss’ kappa for each disorder.

Figure 1 – Calculation of Fleiss’ Kappa
For example, we see that 4 of the psychologists rated subject 1 to have psychosis and 2 rated subject 1 to have borderline syndrome. No psychologist rated subject 1 with bipolar or none.
Other Formulas
We use the formulas described above to calculate Fleiss’ kappa in the worksheet shown in Figure 1. The formulas in the ranges H4:H15 and B17:B22 are displayed in text format in column J, except that the formulas in cells H9 and B19 are not displayed in the figure since they are rather long. These formulas are:
| Cell | Entity | Formula |
| H9 | s.e. | =B20*SQRT(SUM(B18:E18)^2-SUMPRODUCT(B18:E18,1-2*B17:E17))/SUM(B18:E18) |
| B19 | κ1 | =1-SUMPRODUCT(B4:B15,$H$4-B4:B15)/($H$4*$H$5*($H$4-1)*B17*(1-B17)) |
Figure 2 – Long formulas in worksheet of Figure 1
Note too that row 18 (labeled b) contains the formulas for qj(1–qj).
The p-values (and confidence intervals) show us that all of the kappa values are significantly different from zero.
Finally, note that in versions of Excel after Excel 2007, you can use NORM.S.INV instead of NORMSINV and NORM.S.DIST(H10,TRUE) instead of NORMSDIST(H10).
Worksheet Function
Real Statistics Function: The Real Statistics Resource Pack provides the following function:
KAPPA(R1, j, lab, alpha, tails, orig): if lab = FALSE (default) returns a 6 × 1 array consisting of κ if j = 0 (default) or κj if j > 0 for the data in R1 (where R1 is formatted as in range B4:E15 of Figure 1), plus the standard error, z-stat, z-crit, p-value and lower and upper bound of the 1 – alpha confidence interval, where alpha = α (default .05) and tails = 1 or 2 (default). If lab = TRUE then an extra column of labels is included in the output. If orig = TRUE then the original calculation for the standard error is used; the default is FALSE.
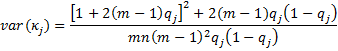
For Example 1, KAPPA(B4:E15) = .2968 and KAPPA(B4:E15,2) = .28. The complete output for KAPPA(B4:E15,,TRUE) is shown in Figure 3.
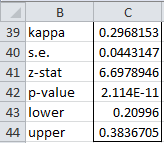
Figure 3 – Output from KAPPA function
Data Analysis Tool
Real Statistics Data Analysis Tool: The Interrater Reliability data analysis tool supplied in the Real Statistics Resource Pack can also be used to calculate Fleiss’s kappa. To calculate Fleiss’s kappa for Example 1 press Ctrl-m and choose the Interrater Reliability option from the Corr tab of the Multipage interface as shown in Figure 2 of Real Statistics Support for Cronbach’s Alpha.
If using the original interface, then select the Reliability option from the main menu and then the Interrater Reliability option from the dialog box that appears as shown in Figure 3 of Real Statistics Support for Cronbach’s Alpha.
In either case, fill in the dialog box that appears (see Figure 7 of Cohen’s Kappa) by inserting B4:E15 in the Input Range, choosing the Fleiss’ kappa option, and clicking on the OK button. The output is shown in Figure 4.
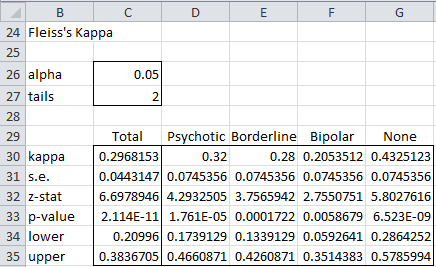
Figure 4 – Output from Fleiss’ Kappa analysis tool
Note that if you change the values for alpha (cell C26) and/or tails (cell C27) the output in Figure 4 will change automatically.
Examples Workbook
Click here to download the Excel workbook with the examples described on this webpage.
References
Cardillo, G. (2009). Algorithm for Fleiss’s kappa, MATLAB
http://www.mathworks.com/matlabcentral/fileexchange/15426-fleisses-kappa/content/fleiss.m
Wikipedia (2013) Fleiss’ Kappa
https://en.wikipedia.org/wiki/Fleiss%27_kappa
Hi actually i wanted to run weighted kappa. But i have 10 observers. I dont know which weighted kappa should i use and how to perform in spss. If you dont mind, could u help me?
Hello Haiqal,
Sorry, but I don’t use SPSS.
Charles
Hi
I want to evaluate the variability of 50 observers (there are 4 groups with different levels of experience) they are going to evaluate only 1 subject (this subject will be making a movement – angulation of the shoulder) I will put 6 angle options that each group has to guess which is the suitable amplitude range.What do you recommend to evaluate this variability or analyze my data?
Elias,
You mention 6 angle options. Does each observer pick one of the 6 angle options or does each observer rate each of the 6 options? In the latter case, what sort of rating is given (e.g. a number from 0 to 5)?
Charles
Hi
https://es.surveymonkey.com/r/BRASIL2022IOT
yes, 50 observers pick or give a “correct” answer to each question
7 questions ( each one with a different angle )
so I have 4 groups ( resident 1, resident 2, resident 3, fellow, and specialist ) this is the level of expertise
Hello Elias,
If I understand the situation well enough, you can calculate Fleiss’ kappa for each of the questions.
You can count each of the 50 observers as a “rater”. Alternatively, you can count each of the groups as a “rater”.
Charles
thank you
appreciate the tip
yeah with that approach ( group as a rater) nice one
https://es.surveymonkey.com/r/BRASIL2022IOT
0-180 degrees
they have to guess the right degree ( number) of angle
https://es.surveymonkey.com/r/BRASIL2022IOT
this is the survey
7 questions
different angle in each one
50 observers
5 groups ( level of experience)
Hi,
I want to evaluate the interobserver variability between three observers (every observer coded 1/3 of the data). For this purpose, I would like to use Fleiss’ kappa. However, some sources mention the observers should be non-unique (randomly selected from a greater group of observers). In my study, there is no “greater group”.
Can I still use Fleiss’ kappa?
Also: how large should my sample be (data coded by all three observers) in comparison to the total dataset?
Thanks you very much,
Babette
Hi Babette,
It is unlikely that you will choose raters at random. Probably best to make sure that there is no obvious correlation. E.g. you won’t want to have a man, his wife, and his son as raters unless you were studying ratings in his family.
Charles
I have 40 students who will evaluate three vignettes (depression, anxiety and schizophrenia are the variables, like raters ). I want to know if there is agreement between the responses of correct identification of the mental health problem (MHP).
Can I use Fleiss Kappa to find out if there is agreement among those who mark MHP correctly?
Hello Luis,
How do you know what the correct diagnosis is?
If you know in advance what the correct diagnosis is and you restrict the responses to these correct diagnoses, then there will be 100% agreement among the raters.
Please clarify what you are trying to measure.
Charles
hello charles
I have three variables (vignettes) with dichotomous choices (mental ill/ not mental ill). Each student responds to the three variables.
The 40 students responded to the three variables, giving a data matrix of 3 columns (vabriables) by 40 rows (cases).
Can I use the Fleiss Kappa ?
The same student is a judge in the three variables.
thanks
Luis,
If I understand correctly, you have several student raters. The ratings are dichotomous (mentally ill or not). When you say that there are 3 variables, do you mean three “patients”? Or are there many patients each being rated based on 3 criteria?
Charles
Luis,
I just reread your comment. It seems that you have 3 criteria that raters are evaluating. Thus, you can use Fleiss’ Kappa to create 3 measures.
Charles
We conducted a study with 20 cases of a rare disease and had experts rate whether they thought the disease was or was not present (Y/N). Because the cases were long, we had one set of raters (6 individuals) rate the first 10 cases and one set of raters (7 individuals) rate the last 10 cases. We want to evaluate the overall agreement between reviewers across all cases rather than analyzing separately for the first 10 and last 10 cases. If we have calculated Fleiss kappa for each set of cases, is there a way to average the values? Our statistical software won’t allow us to calculate this directly due to “missing values” messing up the analysis since the raters did not complete all cases
Hello Kelsey,
Fleiss’ Kappa doesn’t require that the same raters be used. As a result, I don’t understand why there would be missing data.
Charles
Hi Charles,
Wondering if you can help me.
I am doing a survey where we ask people to put items into one of 4 categories. Never will everyone provide judgement on each item due to knowledge breadth. I’m looking to calculate when consensus has been reached on the category that each item is within.
Any advice is greatly appreciated
Hi George,
It sounds like a fit for Gwet’s AC2. See
Gwet’s AC2
Charles
Hello,
I have 3 total raters that used an assessment tool/questionnaire for a systematic review. There were 11 articles and 38 items in the questionnaire (Yes/No). Only two raters assessed each article and the 2 raters (out of 3) were randomly assigned to each article–so not all three rated all articles. Would Fleiss’ Kappa be the most appropriate test in this scenario?
Additionally, if Fleiss’ Kappa is used. How would I account for the fact that we assessed multiple articles?
Thank you,
Carmen
Hello Carmen,
Since not all the raters assessed each article, probably Fleiss’ Kappa is not the right choice. Gwet’s AC2 might be more appropriate. See
Gwet’s AC2
You also need to decide what the “subjects” are for your assessment. E.g. is a subject a questionnaire item or an article (e.g. by summing up the ratings for the items or taking their average rating).
Charles
Thank you, Charles! I’ve been attempting to calculate Gwet’s AC2, however I am starting to get stuck on the Agreement Table. I have determined that my “subjects” are the number of articles. Since there are multiple (38) items in the questionnaire, how do I lay out the agreement table to reflect “x raters gave article a ‘yes’ or ‘no’ rating”? (I’ve assigned yes=1 and no=0).
Thanks again!
Carmen
Hi Carmen,
Perhaps you should fill in the Rating Table and then use the approach described at
https://www.real-statistics.com/reliability/interrater-reliability/gwets-ac2/gwets-ac2-basic-concepts/
to fill in the Agreement Table (or simply use the Real Statistics data analysis tool to do this for you).
Charles
Hi Charles,
first of all, thank you very much for your awesome work, it has helped me a lot!
However, I do have a question: I have 4 service offerings that are categorized based on 10 dimensions. For example, one dimension is who the service is for, with the evaluation categories employee and employer. Another dimension is the data origin with the evaluation categories employee, employer and work environment. These 4 (services) times 10 (dimension), i.e. 40 questions were asked with the help of a survey to 12 people, who sorted the service offerings accordingly. Since the type and number of evaluation categories differ from dimension to dimension, I would have to calculate ten different Fleiss Kappa values (with n=4, m=12 and different values for k). I would then weight these equally and thus condense them into one value. Does this approach seem correct to you?
Any help would be greatly appreciated!
Many thanks,
Johanna
Hi Johanna,
It depends on what your objective is. If you are trying to determine interrater reliability for each service x dimension then you need to calculate 40 different measures. If the 12 raters use categorical ratings for these 40 ratable concepts, then you could use Fleiss’ kappa for each even if the categories differ or the number of categories differs.
You could create weighted averages of these measurements, but it is not clear how you would interpret the resulting value.
Charles
Hi Charles,
Thanks for the quick reply. I am trying to determine the interrater reliability for each dimension which is why I would have calculated 10 measures. The idea was to include four services instead of one into thr survey so that I would have 12 (raters) times 4 (service offerings) for each dimension. The 10 dimensions represent a taxonomy, i.e. the weighted average would give an idea of how applicable the taxonomy as a whole is.
Many thanks,
Johanna
*12 times 4 ratings
Johanna,
1. You could take the rating for each service as some sort of weighted average (or sum) of the 10 dimensions. Then you would have 4 ratings per rater. The only problem with this approach is that typically the interrater measurements are based on unidimensional concepts.
2. The problem with taking a weighted average of the interrater metrics is that it hides information. E.g. suppose that for one of the services, there is agreement among the 12 raters for 6 of the dimensions, but not for the other 4. Now, what would a weighted average tell you?
Charles
Hi Charles,
Many thanks for your reply. Just wanted to let you know that it was a great help and that we followed up on your advice!
Kind regards,
Johanna
Hi Johanna,
Glad I could help.
Charles
Hello,
I was wondering if you can help me decide which type of test I need to use. I am wanting to assess the inter rater reliability of an audit tool for some support plans. There were 2 raters, who rated the quality of 16 support plans. For each support plan, they rated the quality using a 26 point questionnaire. For each of the 26 questions they rated the plans on a 3 point ordinal scale (0, 1, 2). Which statistical test would I use to calculate the overall inter rater reliability? Many thanks
Hello Hannah,
1. If the situation were
2 raters
16 subjects (the support plans), each rated 0, 1, 2
then you could use Gwet AC2 or Krippendorff’s Alpha with ordinal weights
2. You have added the complication that each subject is not rated 0, 1, 2, but on the total score for the questionnaire with 26 items. Thus, the score can take any value from 0 to 52. In this case, you can use Gwet AC2 or Krippendorff’s Alpha with interval or ratio weights (perhaps even ordinal weights, but probably interval is better). You can also use the ICC.
Charles
Hi Charles,
Thank you for the quick reply and recommendations for statistical tests. If I were to treat each questionnaire item as a difference subject (i.e. 16 x 26 = 416 subjects), and then compare the rating of the 2 different raters for each subject, would I use a different statistical test?
Many thanks,
Hannah
Hi Charles,
I was wondering if you had had a chance to consider my follow up query?
Many thanks,
Hannah
Hi Hannah,
My apologies for not replying to your query sooner.
This approach may work, but the “subjects” would not be independent and so I don’t know how much this would undermine the validity of the interrater measurement.
Charles
Dear Charles,
Since the variables I use are ordinal ones, grades 1, 2 and 3 rated with 50 cases rated by 9 observers, it is obvious that Cohen’s kappa is not appropriate. Fleiss’ kappa is an approach, but this is not the best, as some ratings differ by 2 (e.g. grade 1 vs grade 3) and as I understand there is no version for a weighted approach; I haven’t found anything in Fleiss’ Statistical Methods for Rates and Proportions book either. On the other hand, several papers seem to use a weighted approach for the same grades. Do you have any hints, I should follow. Thanks,
Gabor
Dear Gabor,
You can use Krippendorff’s or Gwet’s. They handle ordinal ratings. Both are described on this website and are included in the Real Statistics software.
Charles
Hello,
I have three raters to decide whether or not to include an article in our systematic reviews. for example, I have 4000 articles. rater 1 think 78 of them should be included while 3922 will be excluded, rater 2 think 160 be included while 3840 be excluded, rater 3 think 112 be included while 3888 be excluded. How could I calculate the fleiss kappa in this situation?
Hello Yu Ming,
For rater 1, do you only know that 78 of the 4,00 articles should be included or do you know which of the 78 articles are to be included (and similarly for rater 2 and raters 3)?
Charles
Hello Charles,
I have 1000+ sentences that are coded into 5 categories by 3 raters. Each sentence is coded by the raters. Some of the sentences have same coding for all sentences while others vary based on the categories. Can I apply Fleiss kappa on it to measure agreement?
I don’t completely understand the coding. Can you give an example?
Charles
Hi Charles,
Thank you for this clear explanation.
I would like to be sure I have to use Fleiss Kappa: I would like to calculate the interobserver variability among doctors who evaluated a flow curve (Uroflowmetry). I designed surveys. Each survey consisted of 50 flow curves (6 surveys in total), in which each flow curve had to be evaluated by experienced doctors according to 13 answer options. I would now like to research the interobserver variability among the different answers for each curve, to then calculate the overall interobserver variability.
Also, blinded for participants, the last ten flow curves of each survey were the exact same ones as the first ten flow curves of the survey. This was realised to assess the intra-observer variability. How could I calculate this?
Leonor
Hello Leonor,
1. Are the 13 answer options categorical or ordinal (Likert scale) or numeric? Fleiss’s kappa can only be used for categorical data.
2. Fleiss’s kappa can’t be used when a rater rates the same subject multiple times.
Charles
Hi Charles,
Thanks for your answer.
1. categorical data
2. The raters only rate the same subject once. It’s just that they don’t know that some of the questions in the survey are the same.
If the ratings are categorical and no rater rates the same subject more than once, then Fleiss’ kappa is acceptable.
Charles
Hello Charles,
We are 4 raters looking at 10 x-rays twice. Multiple diagnoses can be present at the same time (so using your example the patient could have borderline and be psychotic at the same time). Should I use the fleiss kappa for this?
Hello Theis,
See the following webpage
https://stats.stackexchange.com/questions/203222/inter-rater-reliability-measure-with-multiple-categories-per-item
It references the paper at
https://www.jstor.org/stable/2529972?seq=1
Charles
Hello Charles
Thank you for your reply!
There are only two categories of the response variable that are being assessed. However, there are multiple response variables. Should I calculate the Fleiss Kappa for each response variable separately?
Theis,
Yes, in this case, probably you need to calculate separate Fleiss kappa values for each response variable.
Charles
Thank you for the post. Very helpful and informative.
Could I ask your advice on which approach I should use to investigate the level of agreement in the below scenario?
Ask more than 100 raters to rate the degree to which the listed items should be included to define a concept- always include, usually include, could include or exclude, usually exclude, always exclude (there are more than 20 items). These raters will take part in rating the items twice (two rounds of survey). Should I use Fleiss Kappa, Kendall’s W or ICC? It seems that I can treat the rating as either categorical or ordinal.
Would appreciate your suggestion.
Thanks,
You should expect a more appropriate measure if you take the order of the ratings into account. THus approaches such as Gwet’s AC2 are more appropriate. You could use ICC but then you are treating the ordinals as numeric ratings. Here, always include, usually include, could include or exclude, usually exclude, always exclude represents a 5-point Likert scale which can be coded as 5, 4, 3, 2, 1.
There are two other factors that may influence your approach:
1. You have a lot more raters than items to rate
2. You have two ratings per item
Regarding item #2, why are there two rounds of survey? Are they two different surveys or are they the same survey that is given at two different points in time. If the latter, what happens between the time of the first round and the second (i.e. why wouldn’t the results be identical for the two rounds)?
Charles
Thank you for the great site Charles!
I have a question: There are 6 raters (doctors) looking at 10 histology slides twice. I want to check how many doctors made the same diagnosis for each slide and if both diagnoses each doctor made were the same. Should I use the fleiss kappa doing three tables (one for the each diagnostic round and a third to compare the two tables) or should i use one table implying that i have 12 raters instead of 6?
Thank you!!!
Why would the doctors perform two diagnoses? Did something happen between the time of the first and second diagnoses?
Charles
i just wanted to test the accuracy of their diagnoses, in case they said something by chance. But probably you are right it should not be needed.
There may be good reasons for making a second diagnosis. This is why I asked whether something happened between the time of the first and second diagnoses.
Charles
Thank you for the excellent software – it has helped me through one masters degree in medicine and now a second one.
I do have a question: in my study several raters evaluated surgical videos and classed pathology on a recognised numerical scale (ordinal). I have two categories of raters (expert and novice). I would like to compare the weighted agreement between the 2 groups and also amongst the group as a whole. In addition i am using a weighted cohens kappa for the intra-rater agreement.
Which would be a suitable function for weighted agreement amongst the 2 groups as well as for the group as a whole?
Annelize,
I assume that you are asking me what weights should you use. This is entirely up to you. There must be some reason why you want to use weights at all (you don’t need to use weights), and so you should choose weights based on which scores you want to weight more heavily.
See Weighted Cohen’s Kappa.
You might want to consider using Gwet’s AC2.
Charles
Can you please advise on this scenario: Two raters use a checklist to the presence or absence of 20 properties in 30 different educational apps. In examining each item in the rating scale, some items show good inter-rater agreement, others do not. To try to understand why some item have low agreement, the researchers examine the item wording in the checklist. They feel that item wording ambiguity may explain the low agreement. They want to reword and re-evaluate these items in each of the 30 apps. The original raters are not available. Can two other raters be used for the items in question, to be recoded? If so, are there any modifications needed in calculating kappa?
Hello Toni,
I don’t completely understand your question (esp. the part about two other raters).
Charles
Hello charles! First of all thank you very much for the excellent explanation!
I did an inventory of 171 online videos and for each video I created several categories of analysis. For example for the format I have: Documentary, Reportage, Monologue, Interview, Animation and Others. To validate these categories, I chose 21 videos representative of the total sample and asked 30 coders to classify them. Can I use Fleiss Kappa to assess the reliability of my categories?
Miguel,
You can use Fleiss’ Kappa to assess the agreement among the 30 coders.
Charles
Hi Charles thanks for this information 🙂
Need some advice… I want to check the inter rater reliability between 2 raters among 6 different cases of brains. Their job is to count neurons in the same section of the brain and the computer gives the total neuron count. However its an estimate and its highly unlikely for raters to get exactly the same neuron counts. Their goal is to be in the same range. We have completed all 6 brain neuron counts but the number of total neurons are different for each brain and between both raters. For example for Brain case 1, rater 1 had a total neuron count of 3177 but rater 2 had total neuron count of 3104. Would Fleiss kappa be the best way to calculate the inter rater reliability between the two? If not what do you suggest? Any help will be greatly appreciated.
Thanks
Krystal
Hello Krystal,
Fleiss’ kappa only handles categorical data. You are dealing with numerical data. Two possible alternatives are ICC and Gwet’s AC2. Both are covered on the Real Statistics website and software.
Charles
Dear Charles,
Thank you for your clear explanation!
I was wondering if you could help me.
I have a study where 20 people labeled behaviour video’s with 12 possible categories. They labelled over 40.000 video’s but non of them labelled the same. Now we want to test their agreement by letting them label a number of the same video’s. Is their a way to determine how many video’s they should test to get a significant outcome? I cant find any help on the internet so far so it would be great if you could help!
Thank you in advance
Jasper
Jasper,
What constitutes a significant outcome for your example?
Charles
Hello, thanks for this useful information. I realised that if the number of judgments for each subject is different, Fleiss’ kappa cannot be used (I get “N/A” error as some users reported). I have two questions and any help would be really appreciated.
1. I want to analyse the inter-rater reliability between 8 authors who assessed one specific risk of bias in 12 studies (i.e., in each study, the risk of bias is rated as low, intermediate or high). However, each author rated a different number of studies, so that for each study the overall sum is usually less than 8 (range 2-8). How can I work this out?
2. I am planning to do the same analysis for other biases (same authors, same studies). Is there any way to get an estimate for the global inter-rater reliability considering all the biases analysed? In such case, how should I proceed?
Thank you very much in advance!
Anthony,
1. To use Fleiss’s Kappa, each study needs to be reviewed by the same number of authors. They don’t need to be the same authors and each author can review a different number of studies.
2. You can use the minimum of the individual reliability measures or the average or any other such measurement, but what to do depends on the purpose of such a measurement and how you plan to use it. What would be the purpose of having such a glocal inter-rater reliability measure?
Charles
Charles,
Thank you very much for your fast answer!
1. I see. Is there any other statistical method that should be used instead of Fleiss’s kappa considering this limitation? On the other hand, is it correct to perform different Fleiss’s kappa tests depending on the number of assessments for each study and then obtain an average value for each bias?. (i.e., for a given bias I would perform one kappa test for studies assessed by 3 authors, another kappa test for studies assessed by 5 authors, etc., and then I could extract an average value). Is there any precaution regarding its interpretation?
2. Excellent, that seems to be in line with my previous thoughts, yet I am not sure which measure would be more interesting, probably an average value would be the best. The purpose is to determine inter-rater reliability since the assessments are somewhat subjective for certain biases. Therefore, a high global inter-rater reliability measure would support that the tendencies observed for each bias are probably reliable (yet specific kappa subtests would address this point) and that general conclusions regarding the “limited methodological quality” of the studies being assessed (which several authors stated) are valid and need no further research.
Thanks again for your kind and useful answer.
Anthony
1. Assuming that you have 12 studies and up to 8 authors are assigning a score from a Likert scale (1, 2 or 3) to each of the studies, then Gwet’s AC2 could be a reasonable approach. See
https://real-statistics.com/reliability/interrater-reliability/gwets-ac2/
2. If you want to have the authors rate multiple types of biases then you could calculate separate AC2 values for each type of bias. How to combine these measurements into one measurement (and whether it even makes sense to do so) depends on how you plan to use the result. E.g. if you take the mean of these measurements, would this value have any meaning for your intended audience (the research community, a client, etc.). I don’t have a specific suggestion for this.
Charles
Thank you so much for your fantastic website! I’m curious if there is a way to perform a sample size calculation for a Fleiss kappa in order to appropriately power my study. Any help you can offer in this regard would be most appreciated.
Hello Ryan,
First of all, Fleiss kappa is a measure of interrater reliability. It is not a test and so statistical power does not apply.
You probably are looking at a test to determine whether Fleiss kappa is equal to some value. I am sorry, but I don’t know how to estimate the power of such a test.
Charles
Hi Charles,
That’s fascinating.
I get that because it’s not a binary hypothesis test, there is no specific “power” as with other tests. But there must still be some extent to which the amount of data you put in (sample size) affects the reliability of the results you get out.
How is this measured? Even if it’s on an ordinal scale, rather than a binary result, how do I know how much weight I should assign to a Kappa test I have run?
Marcus,
Fleiss’ Kappa is not a test, it is a measure of agreement. You can test where there is a significant difference between this measure and say zero. Instead of a weight, you have an interpretation (agreement is high, medium, etc,)
Charles
Hello, This tool is really excellent. Thanks a lot for sharing! I am having trouble running the Fleiss Kappa. My n is 150. I keep getting N/A. I tried with less items 75 and it worked. Is there a cap on the number of items n? Thanks again.
Mona,
There is no cap. If you email me an Excel file with your data and results, I will try to figure out what is going wrong.
Charles
Dear Charles,
first of all thank you for this awesome website! I face the following problem. We are 3 coders and there are 20 objects we want to assign to one or more categories. More precisely, we want to assign emotions to facial expressions. Clearly, some facial expressions show, e.g., frustration and sadness at the same time. So I was wondering if we can use Fleiss Kappa if there are multiple categories that can be assigned to each facial expression. Our approach is now to transform our data like this:
We have 3 columns (each for one coder), and 10×20 (objects x category) rows for the categories. For each coder we check whether he or she used the respective category to describe the facial expression or not (1 versus 0).
________coder 1 coder 2 coder 3
sadness 0 1 1
frustration 1 1 1
:
:
sadness
frustration
:
:
Thank you very much for your help!
Best regards
Samai
Samai,
Fleiss’s kappa requires one categorical rating per object x rater. For your situation, you have 8 possible ratings: 000, 001, 010, 011, 100, 101, 110, 111. If there is no order to these 8 categories then you can use Fleiss’s kappa. If you do have an ordering (e.g. 010 < 110 < 111), then you need to use a different approach. Gwet's AC2 could be appropriate if you know how to capture the order. Charles
Dear Charles,
thank you!
Dear charles, you are genius in fleiss kappa. Very nice presentation and to the point answer. I am working on project with questionnaire and I have to do the face validity for final layout of questionnaire. For that I am thinking to take the opinion of 10 raters for 9 question (i. Appropriateness of grammar, ii. The correct spelling of words, iii. Legible printout, iv…, v…, vi…,vii…,viii…,ix…) with 2 category (Yes/No). So is fleiss kappa is suitable for agreement on final layout or I have to go with cohen kappa with only two rater. My suggestion is fleiss kappa as more rater will have good input. Please share the valuable input.
Hello Sharad,
Cohen’s kappa can only be used with 2 raters. Since you have 10 raters you can’t use this approach. Fleiss’s kappa may be appropriate since your categories are categorical (yes/no qualifies). If I understand correctly, the questions will serve as your subjects. The only downside with this approach is that the subjects are not randomly selected, but this is built into the fact that you are only interested in this one questionnaire. The approach will measure agreement among the raters regarding the questionnaire. This is not the same as validity, though.
Charles
We are looking to calculate kappa for an instance where 45 raters evaluated 10 fictitious teacher profiles across five teaching standards (there are 30 total indicators across the five standards). Is Fleiss’ kappa the correct approach?
Timothy,
Does this mean there are 6 indicators for each of the five standards or are there 30 indicators for each standard? What sort of values are these standards? In particular, are they categorical or is there some order to the indicators?
Charles
Hi, Thank you for this information….I’d like to run inter-rater reliability statistic for 3 case studies, 11 raters, 30 symptoms. Each rater read the case study and marked yes/no for each of the 30 symptoms. Would Fleiss’ Kappa be the best method of inter-rater reliability for this case? If not, what would you recommend? Additionally, what is $H$5? I tried to follow the formulas that you had presented.
Hello May,
H5 represents the number of subjects; i.e. the number of entities that are being rated.
If I understand correctly, for your situation you have 90 “subjects”, 30 per case study. Provided that each symptom is independent of the others, you could use Fleiss’ Kappa. In general, I prefer Gwet’s AC2 statistic.
Charles
Thank you for this tutorial! Using the same data as a practice for my own data in terms of using the Resource Pack’s inter-rater reliability tool – however receiving different values for the kappa values
If you email me an Excel spreadsheet with your data and results, I will try to understand why your kappa values are different.
Charles
I’ve been asked by a client to provide a Kappa rating to a test carried out on measuring their parts. We have a pass or fail rate only when the parts are measured so I provided a 1 for pass and 0 for fail
All came out has a pass so all scores were a 1. I’ve tried to put this into an excel spreadsheet and use your calculation but the kappa comes out at minus 0.5.
Is this right or wring. if wrong I do not know what I’ve done wrong to get this figure. Any help would be appreciated
Hello Colin.
If you email me an Excel spreadsheet with your data and results, I will try to figure out what went wrong.
Charles
I was wondering how you calculated q, B17:E17? I apologize if you’ve gone over this in the instructions and I missed.
Thank you for the helpful explanation!
And now I see it in row 18, I’m sorry for the bother.