The intraclass correlation (ICC) assesses the reliability of ratings by comparing the variability of different ratings of the same subject to the total variation across all ratings and all subjects. The ratings are quantitative.
Topics
- Basic concepts of the ICC(2,1) model (this webpage)
- Other ICC models
- Using ICC for comparisons against a gold standard
- Using ICC for test/retest reliability
Examples
We illustrate the ICC technique applied to Likert scales via the following example.
Example 1: Four judges assess 8 types of wine for quality by assigning a score from 0 to 9 with the ratings given in Figure 1. Each judge tests each wine once. We would like to determine whether the wines can be judged reliably by different judges.

Figure 1 – Data for Example 1
We can see from the data that there is a fair amount of consistency between the ratings of the different judges with a few noticeable differences.
We will assume that the four judges are taken from a random sample of judges and use Excel’s Anova: Two Factor without Replication data analysis (i.e. a repeated measure analysis). Figure 2 shows the results of this analysis.

Figure 2 – Calculation of Intraclass Correlation
Here the rows relate to the Between Subjects (Wines) and the columns relate to the Judges (who are the raters). The error term is Judge × Subjects. We have added row 29 which contains the calculation of the ICC (in cell I29) using the formula
=(J23-J25)/(J23+I24*J25+(I24+1)*(J24-J25)/(I23+1))
ICC based on Variability
We will now explain this formula. From Definition 1 in Two Factor ANOVA without Replication we have the model
![]()
The intraclass correlation is then
![]()
Thus there are three types of variability:
var(β): variability due to differences in the subjects (i.e. the wines).
var(ε): variability due to differences in the evaluations of the subjects by the judges (e.g. judge B really likes wine 3, while judge C finds it to be very bad)
var(α): variability due to differences in the rating levels/scale used by the judges (e.g. judges B and C both find wine 1 to be the worst, but while judge C assigns wine 1 a Likert rating of 0, judge B gives it a bit higher rating with a 2).
We can estimate each of these as follows:
var(β) = (MSRow – MSE)/k = (26.89 – 2.28)/4 = 6.15
var(ε) = MSE = 2.28
var(α) = (MSCol – MSE)/n = (2.45 – 2.28)/8 = 0.02
where n = number of rows (i.e. subjects = wines for Example 1) and k = number of columns (i.e. raters = judges). We, therefore, obtain a consistent (although biased) estimate of the intraclass correlation by
ICC = 6.15/(6.15 + 2.28 + 0.02) = 0.728
This can also be expressed by
![]()
![]()
The high value of ICC shows there is a fair degree of agreement between the judges.
Real Statistics Support
Real Statistics Function: The Real Statistics Resource Pack contains the following function:
ICC(R1) = intraclass correlation coefficient of R1 where R1 is formatted as in the data range B5:E12 of Figure 1.
For Example 1, ICC(B5:E12) = .728. This function is actually an array function that provides additional capabilities, as described in Intraclass Correlation Continued.
Real Statistics Data Analysis Tool: The Interrater Reliability data analysis tool supplied in the Real Statistics Resource Pack can also be used to calculate the ICC. We show how to use this tool in Intraclass Correlation Continued.
Observation: There are a number of other measures of ICC in use. We have presented the most useful of these measures above. Click here for information about these other versions of ICC.
Confidence Interval
We now show how to calculate an approximate confidence interval for the ICC. We start by defining the following
![]()
![]()
![]()
![]()
![]()
![]()
Note that for newer versions of Excel, the FINV function should be replaced by F.INV.RT.
From these we calculate the lower and upper bounds of the confidence interval as follows:
![]()
![]()
Using these formulas we calculate the 95% confidence interval for ICC for the data in Example 1 to be (.434, .927) as shown in Figure 3.
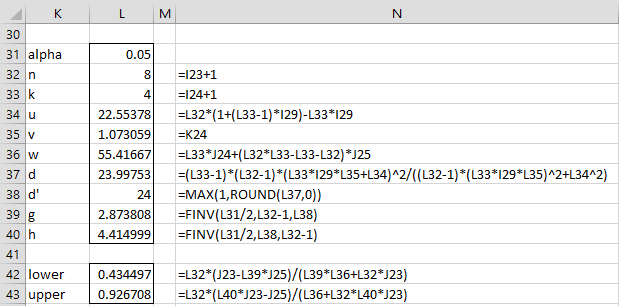
Figure 3 – 95% confidence interval for ICC
As stated above, for newer versions of Excel, the FINV function in cells L39 and L40 should be replaced by F.INV.RT.
Observations
The ratings by the judges indicate the difficulty or leniency of the judge. The raters can also be questions in a test. In this case, the rating corresponds to the difficulty or leniency of the question.
The measure of ICC is dependent on the homogeneity of the population of subjects being measured. For example, if the raters are measuring the level of violence in the general population, the value of var(β) may be high compared to var(α) and var(ε), thus making ICC high. If instead, the raters are measuring levels of violence in a population of inmates from maximum-security prisons, the value of var(β) may be low compared to var(α) and var(ε), thus making ICC low.
There isn’t universal agreement as to what constitutes an acceptable ICC value. This can also depend on the field in which it is used. E.g. in the medical field, an ICC less than .40 is considered to be poor, between .40 and .50 fair/moderate, between .60 and .75 good and ICC = .75 and above excellent. Others will change these boundaries to .50, .75 and .90.
Reference
Shrout, P .E. and Fleiss, J. L. (1979) Intraclass correlations: Uses in assessing rater reliability. Psychol. Bull., 86: 420-428.
https://www.aliquote.org/cours/2012_biomed/biblio/Shrout1979.pdf
Hi Charles
Thank you for clear review of ICC, you defined confidence interval above, if we have wide confidence width, what does it tell us about the data?
Hi Elle,
It likely means that you need a larger sample to get a more definitive picture (and a narrower confidence interval).
Charles
Hello Charles,
I am assessing test-retest reliability of a self-administered questionnaire where items are rated with a Likert-type scale (1-5). But I am assessing test-retest reliability of the total score of the questionnaire, which is obtained by the sum of the items. However, my data are non-normally distributed (n=35), and thus I should avoid the ICC. Can I use Gwet’s AC2 in place of the ICC to avoid the normality assumption in this continuous variable? Could I use the central limit theorem to justify the use of the ICC? Are there other options? What would be the most appropriate approach?
Hello Marcos,
1. It depends on what you mean by test-retest reliability. Are you performing an analysis such as that shown in Examples 2 and 3 of the following webpage?
https://www.real-statistics.com/reliability/interrater-reliability/intraclass-correlation/icc-for-test-retest-reliability/
2. Data for large enough samples tend to be normally distributed per the central limit theorem. But if you have tested the actual data and found them not to come from a normally distributed population, then you can’t assume normality.
3. I don’t believe that Gwet’s AC2 requires normality, but I don’t know whether it does what you are looking for.
Charles
Hi,
Thank you for your useful explanations. It has helped me a lot.
I’m trying to use ICC in order to check the reliability of ratings before aggregating them and reporting a single value. I’d be more than happy if you could help me out in the following scenario:
A team of experts (variable size S, 2<S<10) are given S copies of the same 6-item survey with Likert-scaled questions. They are given the task to evaluate each of the S people (including themselves) by giving scores to each question in the survey for each of the S people. A score given to a question (or, statement) is an integer between 1 and 5. Each evaluation is then scored by calculating the average of each question's score. At this step, we'll be able to have a dataset like the wine and judge example, which will be an S*S matrix omitting the titles, roughly like the following:
James John Jennifer Sara
James 1.33 2 2.25 4
John 3.33 3.66 4.2 2.85
Jennifer 1 2.6 2.44 2.5
Sara 2.33 3 3.25 5
We'd want to check the interrater reliability, then if reliable, calculate the average of the scores given to a member of the team like the following:
James: 2.395
John: 3.51
Jennifer: 2.135
Sara: 3.395
Then, we'd want to aggregate the score at the team level.
I have the big picture in my mind but I'm still not sure how to do it and whether I'm thinking the right way. I'm pretty much a novice in statistics.
What are you trying to accomplish? Are you trying to determine the reliability of the questionnaire? Are you trying to determine whether there is agreement among the 4 people?
hi,
thank you for your response. yes, I’m trying to accomplish the latter, then mark those records which indicate a disagreement within raters as noise.
What do you recommend?
Hi. You can use any of a number of measurements, including the ICC (as well as Gwet’s AC2 and others) to determine the agreement between the raters. I don’t know how well these measurements handle the case where raters rate themselves.
I don’t know how to determine records that indicate disagreement. One possible approach is to remove one or more records and see how the interrater measurement changes.
Charles
Hi,
I am looking at 3 raters, who are rating how long it took for a patient to fall asleep. Each patient has 5 naps, and there are 13 patients (around 60 naps in total).
So each marker will mark each patient nap (all 60) and I want to look at interrater agreement. As far as im aware I cannot use intraclass correlation coefficient as there are repeated measures from the same patient. Do you think a repeated measures anova would be better? Does the repeated measures anova sound better to use in this instance?
Thanks
Hi Faizah,
Sorry for the delayed response.
The following link might be useful in addressing this problem.
https://www.reddit.com/r/AskStatistics/comments/btyh3v/icc_for_two_raters_with_repeated_measurements/
Charles
Hello!
Beginner question:
I would like to compare two estimations of tumor cell content in ~350 samples: one by pathology and one by bioinformatic measurements after sequencing.
Can I use ICC for this oder should I consider another method? e.g the concordance correlation coefficient?
Thank you very much in advance!
Best,
Luca
Hello Luca,
What specifically do you mean when you say that you “would like to compare these two estimations of tumor cells”?
Are you trying to show that the two methods give the same results? ICC can be used as explained at
https://www.real-statistics.com/reliability/interrater-reliability/intraclass-correlation/icc-compare-against-gold-standard/
Bland-Altman and Lin’s CCC might also be appropriate
https://www.real-statistics.com/reliability/interrater-reliability/bland-altman-analysis/
https://www.real-statistics.com/reliability/lins-concordance-correlation-coefficient/
Depending on what you are trying to accomplish, a two-sample t-test or Mann-Whitney test may be used.
Charles
Dear Charles,
thank you for nice tutorial about ICC.
I have question about scenario with more then one measures per one observer at same subject. Example: 8 subjects (wine), 4 observers (judges) but each judge tests each wine three times.
Thank you!
Dragan,
Why would the rating change each time the rater tastes the wine?
Charles
Thank you for response but I need information how to make scenario with repeated measures.
Dragan,
Perhaps the following two links will be useful:
https://stats.stackexchange.com/questions/81454/icc-in-a-linear-mixed-model-longitudial-data-why-is-this-the-correlation-bet
https://www.reddit.com/r/AskStatistics/comments/btyh3v/icc_for_two_raters_with_repeated_measurements/
Here is another relevant link, although I am not sure whether it addresses your issue.
https://www.ncbi.nlm.nih.gov/pmc/articles/PMC6645485/
Charles
Hi Charles,
I found the explanations here really useful thank you.
With the interpretation, do you have a reference for the comment:
“E.g. in the medical field, an ICC less than .40 is considered to be poor, between .40 and .50 fair/moderate, between .60 and .75 good and ICC = .75 and above excellent. Others will change these boundaries to .50, .75 and .90.”
The ICC I calculate is 0.67, which seems pretty reasonable to me but I haven’t found a reference to quote.
thanks
Damian
Damian,
See https://www.ncbi.nlm.nih.gov/pmc/articles/PMC4913118/#:~:text=A%20flowchart%20showing%20readers%20how,than%200.90%20indicate%20excellent%20reliability.
Charles
Thank you for all the information! I have a question about absolute agreement and consistency, which of these is the output of the ICC function? I am analyzing the work of 66 students (scores ranging from 0-60) graded by 4 different raters (each rater graded all students) and so I chose class 2 for the ICC class and for type = 4. I am just not sure whether the ICC value is one for absolute agreement or consistency, do you mind explaining this to me or guiding me to useful resources? Thank you very much.
Michael,
The difference is explained at https://en.wikipedia.org/wiki/Intraclass_correlation#:~:text=Absolute%20agreement%3A%20the%20agreement%20between,random%20residual%20error%20is%20kept.
https://www.ncbi.nlm.nih.gov/pmc/articles/PMC3670985/
https://www.ibm.com/support/pages/how-can-icc-reliability-be-higher-absolute-agreement-consistency
Thanks for your question. This can be confusing. I will eventually expand on this topic on the Real Statistics website.
Charles
Apologies, it was my VBA code.
Thank you so much for this resource!!! You are very smart to understand all these bloody stats!~
Thank you so much for taking the time to educate the internet 😉
May I add a question, too? We want to determine interrater reliability between 2 raters.
They each scored 20 participants, using 5 items that together form a scale (happiness), and one item (quality) which is evaluated differently.
Is it correct that we would determine two ICCs, one using the 20 totalscores on happiness as input, and one ICC using the 20 (item) scores on quality as input?
Are 20 observations enough?
for clarification:
one ICC using the 2x 20 totalscores on happiness as input,
and the other using the 2×20 item scores on quality as input.
See my previous reply.
Charles
Hello Hanna,
1. You can use this approach.
2. Whether or not 20 observations is enough depends on what you mean by “enough”. You can calculate the ICC with even fewer than 20 observations. How you interpret the ICC value does depend on the confidence interval of the ICC value, which in turn depends on the number of observations.
Charles
Thank you for such a thorough website and for the Resource Pack! I would like to calculate the interrater reliability of my students’s ratings on a measure after watching a video to the gold standard ratings for that video. The ratings are on a scale from 0 through 4. Can I still use the Intraclass Correlation function in your Resource Pack?
I tried it out on some data that I have, and while it appears to work on videos in which the ratings were mostly between 1 – 4, on a video in which the ratings were predominantly 0’s, with a few 1’s, I get a negative ICC.
Alternatively, it seems to work (again) for the video that has ratings between 1 – 4, in which my student obtained a 0.93 ICC after missing 4 items, but on the video with predominantly 0’s and 1’s, she obtained an ICC of 0.65 after missing only 1 item!
Thank you!
Hello Constance,
The approach for comparison against a gold standard is described at
https://real-statistics.com/reliability/interrater-reliability/intraclass-correlation/icc-compare-against-gold-standard/
Charles
Hello Charles
Thank you very much for this incredibly rich resource.
I am analyzing data where 4 scorers, all scored the same 16 trials. I want to evaluate the homogeneity of scoring.
In addition to calculating the ICC for all 4 scorers I also do pairwise ICC for each scorer pair (1 &2, 1&3, 1&4, 2&3…etc) and noticed that a single outlier (large difference in score between scorers) impacts the ICC score a lot (0.82 vs. 1.00 when excluded). (=ICC(data,2,1,True,0.05)
Is this normal or am I doing something incorrectly?
Do you recommend some other type of statistical test for this type of data?
Thank you.
It is difficult for me to say without seeing the data.
If this one “outlier” is excluded I see that ICC = 1.0, which means there is perfect agreement. Is this so?
Charles
Hi, thank you for the post. Why do you say that the ICC you estimated is biased? You said that it is consistent, but biased. How can we estimate an unbiased coefficient?
Luis,
I believe that I am reflecting what was written in the original research paper (although I should really check this). The ICC value is quite useful which probably means that the bias is small.
Charles
Luiz,
I believe that this what was stated in the original research paper (although I should have checked this). In any case, the ICC estimate is quite good. I don’t know one that is less biased.
Charles
Hi Charles, thank you for your sincere answer!
Hello
Is icc appropriate to assess repeatability and reproducibility between two raters each reading two measurements?
Thanks
It depends on what you mean by repeatability and reproducibility. Perhaps the following article will be helpful
https://www.sciencedirect.com/science/article/pii/S0894731719309460
Charles
Bonjour Charles, je suis Axel, je mène un projet de recherche avec des collègues qui a pour but de créer un manuel de codage des publications sur les réseaux sociaux au travers d’une revues bibliographique. Après avoir fait une sellection sur 743 articles a partir d’une méthodologie de sellection ou moi et ma collègue avons collectionnés séparément des articles, voulons utiliser le ICC ceci pour confronter nos sellections et voire s’il existe une corrélation dans nos sellections séparés. nous avons 3 indicateurs de sellection S1, S2, S3 deux de rejet R1 et R2. Je voulais attribué à chaque code un chiffres afin de trouver le ICC mais je suis bloqué d’ou je viens vers vous.
Je voulais surtout utiliser la classe 1 comme indiqué dans votre document mais je ne suis pas sure de moi.
Classe 2 : les k évaluateurs sont choisis au hasard dans une population de évaluateurs et ces k évaluateurs évaluent tous les n sujets.
J’ai besoin de votre aide s’il vous plaît
Hello Charles, I am Axel, I am conducting a research project with colleagues which aims to create a manual for coding publications on social networks through a bibliographic review. After having made an sellection on 743 articles from an sellection methodology where I and my colleague have collected articles separately, we want to use the ICC this to compare our sellings and even if there is a correlation in our separate sellings. we have 3 sellection indicators S1, S2, S3 two of rejection R1 and R2. I wanted to assign each code a number in order to find the ICC but I am blocked from where I am coming to you.
I mainly wanted to use class 1 as indicated in your document but I am not sure of myself.
Class 2: the k assessors are chosen at random from a population of assessors and these k assessors assess all n subjects.
I need your help please
Hello Axel,
Please confirm whether the following is true:
You have 743 articles that are being assessed
You have two raters (you and your colleague)
You have 3 selection indicators and 2 rejection indicators. Do you choose one of S1, S2, S3 if the article is selected and one of R1, R2 if the article is rejected?
Charles
We choose just one of indicator per article, but my choosen indicator could be different of the indicator of my collegue, in this fact we want to used ICC to see if all award choose hava an corrhelation
See reply in English
Hello Charles, Yes we are working on 743 items that we have to individually select or reject using a sellection manual. The first step is to validate this manual for sellection of articles. To validate it we want to see if there is a correlation of sellection between our two article analyzes. The analysis is done individually by me and my colleague. Not being too expert in ICC we want to use it to validate the consistency of our two article analysis. Yes there are 5 stages including 3 sellection and 2 rejection. Sellection S1, S2, S3, and rejection R1 and R2.
Hello Axel,
I am trying to determine whether for each of the 743 items you assign one rating from the five categories S1, S2, S3, R1 and R2 (and similarly for your colleague).
Item You Colleague
1 S1 S2
2 R1 R1
3 S2 S2
4 S3 S1
etc.
If it is a little more complicated than this, please explain so that I can determine whether ICC is appropriate.
Charles
Yes Charles me and my collegue have different choose as
1 S1 R1
2 R2 S3
3 S3 R1
4 R2 S1 …
But in award method of selection of article, S1 you select article by keys words of the title , S2 Select my Concept of title, R1 you rejet if the title don’t speak about award idem of research, S3 selection of abstrat concept and R2 rejet after reading abstract.
I have a data set with 2 raters, each rating 6 different subjects/parameters (measurements), with each of the 2 raters rating each of the 6 parameters three separate (independent) times.
How do I set up the Excel file for this analysis and do I use ANOVA with replication to eventually calculate the ICC?
Hi Wei,
Real Statistics hasn’t implemented this yet, but here are some sources about this issue:
https://journals.plos.org/plosone/article?id=10.1371/journal.pone.0219854
https://www.reddit.com/r/AskStatistics/comments/btyh3v/icc_for_two_raters_with_repeated_measurements/
https://stats.stackexchange.com/questions/229443/icc-agreement-with-repeated-measures
Charles
Charles,
Thank you for the quick reply and the info.
Much appreciated.
Thanks for this! I would just like to ask, how do I calculate the intraclass correlelation coefficient if i have 6 raters and they have to rate all 102 items twice, one for its content validity and another for its structure validity? (one rater = 2 ratings). Thank you very much for your help!
Hi Marie,
You should calculate two ICC values, one for each rating.
Charles
Hello,
This is very insightful. Please is ICC parametric or non parametric? How does the two way mixed ICC (where the judges are the only ones of interest) differ from Pearson correlation?
Thank you
Hello Suzan,
1. ICC is parametric
2. ICC is not the same as Pearson’s correlation. See the following for details:
https://en.wikipedia.org/wiki/Intraclass_correlation
Charles
Hello Dr. Zaiontz,
How do you deal with missing data in these calculations? If one of my raters did not input a value for a continuous variable, then that datapoint is simply excluded from the analyses by SPSS (obviously since there is no numeric value). However, this is clearly leading to an overestimation of my ICC value because it is simply excluding the discrepancy between coders. Is there any way to handle this with ICC calculations? I also have this for categorical variables, which I use kappa to assess reliability but I can input “missing” as a category in those cases, please correct me if I am wrong. Thank you!
Hello Jen,
These sorts of issues are described in the following book
Handbook of Inter-Rater Reliability by Gwet
Note too that Gwet’s AC2 measurement can be used in place of ICC and Kappa and handles missing data. This approach is supported by Real Statistics. See
Gwet’s AC2
According to the following article, listwise deletion is a reasonable approach for Cohen’s Kappa.
https://journals.sagepub.com/doi/abs/10.1177/0013164418823249
Charles
Hello,
can I use ICC to assess the agreement of 6 different immunochemistry methods on 122 patients for measurement of one qunatitative variable? The values itself are not directly comparable regarding the different antibody used, however the final outcome (normal or abnormal) should be the same.
Thank you!
Hello Vanja,
You can use ICC treating the 6 different immunochemistry methods as the raters provided the ratings are numeric. I don’t fully understand your last sentence though.
Charles