The Real Statistics Resource Pack provides an option for identifying potential outliers in a sample. Assuming the sample is normally distributed (based on the Central Limit Theorem), we know that NORM.S.DIST(-2.5,TRUE) = 0.621% of the data should have a z-score less than -2.5. Similarly, 0.621% of the data should have a z-score greater than 2.5. Here we use 2.5 as a somewhat arbitrary criterion for a potential outlier. E.g. for a sample of size 80, on average 80(.00621)(2) = .994, and so about one element will be viewed as a potential outlier.
Data Analysis Tool
Real Statistics Data Analysis Tool: One of the options of the Descriptive Statistics and Normality data analysis tool provided in the Real Statistics Resource Pack is the identification of potential outliers using a specified z-score (default 2.5).
Example 1: Identify potential outliers for the three data samples on the left side of Figure 1 (range B3:D16).

Figure 1 – Identifying potential outliers and missing data
Enter Ctrl-m and select the Descriptive Statistics and Normality data analysis tool. Fill in the dialog box that appears as shown in Figure 2. Leave the Outlier Limit field blank since we want to use the default value of 2.5.
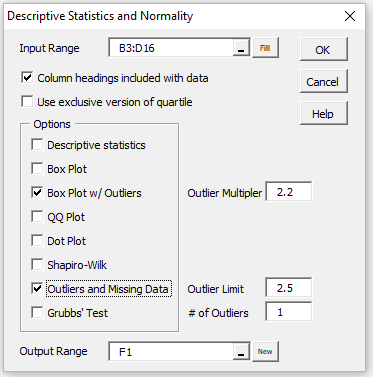
Figure 2 – Dialog box for Descriptive Statistics and Normality
The output as displayed on the right side of Figure 1 shows there are two potential outliers (indicated by the asterisks in column P): namely item 9 of Sample C and item 12 of Sample B. Item 9 of Sample C has a z-score of -2.52391 (cell P17), which is less than -2.5. Item 12 of Sample B has a z-score of 2.62457 (cell N20), which is greater than 2.5.
Note that the z-scores are calculated in the usual way: e.g. the z-score for item 1 of Sample 1 (cell L9) is calculated by the formula =STANDARDIZE(B4, M4, M5).
Note that just because a data element is identified as a potential outlier doesn’t mean that it is wrong or should be eliminated, but it does mean that that data element should be investigated to see if a typing mistake has been made or some other problem has occurred that will distort any analyses that are undertaken.
The output also totals up the number of blank cells (2 for Sample 3) and non-numeric cells (1 for Sample 2, indicated by a series of asterisks in cell N21). These can represent potential missing data. See Dealing with Missing Data for how to deal with missing data.
Observations
Another popularly used method for identifying outliers is to denote any data element larger than Q3 + 1.5*IQR or smaller than Q1 – 1.5*IQR as a potential outlier, where Q1 and Q3 are the first and third quartiles (see Ranking) and IQR is the inter-quartile range (see Measures of Variability). This is the approach used in creating box plots.
The box plot displayed in Figure 1 identifies three potential outliers, the two outliers identified above, along with item 4 of Sample A which is just under the 2.5 threshold with a z-score of 2.424183 but does achieve the 1.5*IQR threshold required for the box plot.
If the Percentage option is set on the Configuration dialog box, then you should enter a value 100 times the desired value in the Outlier Limit field in the dialog box in Figure 2; e.g. enter 300 if you want a 3.0 outlier limit. If you leave this field blank, the outlier limit defaults to 2.5.
Worksheet Function
Real Statistics Function: The Real Statistics Resource Pack provides the following function, where if type = 0 then the test using the mean and standard deviation is employed while if type = 1 then the test using the IQR is employed.
STANDARD(x, R1, type, exc) takes the value
| STANDARDIZE(x, x̄, s) | if type = 0 (default) | |
| (x−Q3)/IQR | if type = 1 and x > Q3 | |
| (x−Q1)/IQR | if type = 1 and x < Q1 | |
| 0 | otherwise (type = 1 and Q1 ≤ x ≤ Q3) |
where x̄ = AVERAGE(R1) and s = STDEV(R1).
If exc = TRUE then Q1 = QUARTILE.EXC(R1,1) and Q3 = QUARTILE.EXC(R1,3)
If exc = FALSE (default) then Q1 = QUARTILE.INC(R1,1) and Q3 = QUARTILE.INC(R1,3)
The STANDARD function plays a role similar to the STANDARDIZE function when type = 0 (except that the mean and standard deviation are calculated from R1). It plays the equivalent role using the median and IQR when type = 1.
For type = 0, if the value of the STANDARD function at x is larger than 2.5 or less than -2.5 we can consider x to be a potential outlier (although we can change 2.5 to 3.0 or some other value as we choose).
Similarly for type = 1, if the value of the STANDARD function at x is larger than 1.5 or less than -1.5 we can consider x to be a potential outlier (although we can change 1.5 to some other value as we choose).
Example using STANDARD function
Example 2: Identify potential outliers for the data set in range B3:D8 of Figure 3.
We insert the formula =STANDARD(B3,$B$3:$D$8) in cell F3, highlight the range F3:H8, and press Ctrl-R and Ctrl-D to fill in the range F3:H8 with the values shown in Figure 3. If we set a cutoff of ±2.5 for outliers, we see that the only value exceeding the cutoff is 2.816972 (cell H5), which means that the data element 99.5 (cell D5) is a potential outlier.
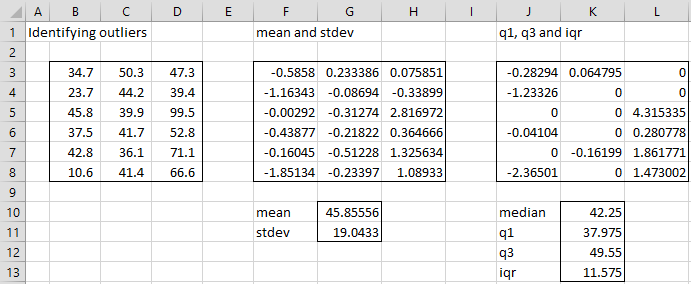
Figure 3 – Identifying potential outliers using STANDARD
If we use the type 1 approach instead of the type 0 approach, we insert the formula =STANDARD(B3,$B$3:$D$8,1) in cell J3, highlight the range J3:L8 and press Ctrl-R and Ctrl-D to fill in the range J3:L8 with the values shown in Figure 3. If we set a cutoff of ±1.5 for outliers, we see that the only values exceeding the cutoff are 4.315335 (cell L5) and -2.36501 (cell J8), which means that the data elements 99.5 (cell D5) and 10.6 (cell B8) are potential outliers.
Note that values in the range B3:D8 between Q1 (37.975) and Q3 (49.55) take a zero value in range J3:L8.
Grubbs’ Test
Another approach to identifying outliers uses Grubbs’ test.
Examples Workbook
Click here to download the Excel workbook with the examples described on this webpage.
References
NIST (2023) What are outliers in the data?
https://www.itl.nist.gov/div898/handbook/prc/section1/prc16.htm
Frost, J. (2019) 5 ways to find outliers in your data.
https://statisticsbyjim.com/basics/outliers/
Charles
Love this website, must be a lot of work to maintain. Thanks for that
I’m using a dutch version of Excel which may explain the thing I found which is:
For calculation of the outliers in example a formula that looks similar the one below
=COUNTIF(M76:M88,”>=$K$68″)+COUNTIF(M76:M88,”=”&$K$68)+COUNTIF(M76:M88,”<=-"&$K$68)
Now this formula returns 1 for the number of outliers in C
I changed the way the <= and <= are connected to the check value in cell K68 (2.5).
in the example sheet you use 2.5 instead of the cell address which works fine.
Regards
Q
Hi Q,
Thanks for your kind words about the website and for your support.
You ask interesting questions and have made useful comments. Unfortunately, I wasn’t able to understand this comment.
Were you able to insert a decimal value such as 2.5 or 2,5 into the dialog box?
Charles
Time Series Outlier Boxplot Analysis in Excel
Apply the Boxplot’s powerful business statistics theory to do time series segmentation data analysis at the click of a button. The time series outliers algorithm in this Excel template will sift through 12 columns (eg. months, quarters, weeks, days) of metrics looking for – and flagging – outliers in each. It will then perform a time series analysis and automatically flag every record in your dataset with a segment variable indicating a statistically significant time series pattern of behaviour across your 12 columns of data. You may then create a time series chart from the segment variable to visualize each segment’s behaviour over time.
Is there a way to calculate the standard deviation in a given data set excluding the outliers?
Steve,
The obvious answer is to use STDEV(R1) where R1 is the data with the outliers excluded.
Perhaps I am missing the point of your question.
Charles
That is obvious.
Is there a Standard Deviation excel formula on R1 that can compute the Standard Deviation with the outliers excluded withought having to manually remove the outliers from R1 dataset? Also, thank you so much for providing this resource for free – you are amazing.
Hello Steve,
This depends on which approach you are using for identifying potential outliers. The Real Statistics website describes several different approaches. E.g. suppose your data is in D3:E11 and you define outlier as more than 2.5 standard deviations from the mean, then the following array formula will do what you are looking for:
=STDEV.S(IF(STANDARDIZE(D3:E11,AVERAGE(D3:E11),STDEV.S(D3:E11))<2.5,D3:E11,""))
Charles
Thanks for y our reply Charles. Oddly enough the excel formula you listed doesn’t seem to work for me. This formula
=STDEV.S(IF(STANDARDIZE(D3:E11,AVERAGE(D3:E11),STDEV.S(D3:E11))<2.5,D3:E11,""))
and this formula =STDEV.S(D3:E11) return the same results.
See my response to your other comment.
Charles
Charles,
Thanks for your response. One thing that is happening with my data set is that the example formula your provided:
=STDEV.S(IF(STANDARDIZE(D3:E11,AVERAGE(D3:E11),STDEV.S(D3:E11))<2.5,D3:E11,""))
Returns the same value as =STDEV.S(D3:E11). Even if change the the values in the data set, the values returned always equal. I think it is because
=STANDARDIZE(D3:E11,AVERAGE(D3:E11),STDEV.S(D3:E11))<2.5
always equals TRUE.
Many thanks for your guidance and thoughts.
Hello Steve,
You can pick any value as the cutoff for being an outlier (2.5 in the above formulas). If your data doesn’t have any outliers based on this cutoff, then the mean and standard deviation will be the same as the values for the full data set.
Charles
Just copy the set, delete the outliers, and recompute the mean and standard deviation.
The IQRs are not adjusted. The IQRs adjacent the outliers are less dense. I see them as errors, but statistics is approximate in a lot of situations.
Dejar Charles,
I think this is an error:
1−NORMSDIST(2.5) = 0.621% of the data should have a z-score larger than 2.5 or less than -2.5.
Hello Gabriel,
What is stated is correct, but confusing. I have reworded it on the webpage. I hope this is clearer. Thanks for pointing this out.
Charles
examine the HATCO data. Specifically, your are expected to evaluate the missing data, identify outliers, and testing the assumptions underlying most multivariate techniques. Report your data examination by considering the following questions;
a. Select the appropriate graphical methods to examine the characteristics of the data and the relationships of interest.
b. Analyse the different types of missing data process.
c. Assess the type and potential impact of missing data.
d. Explain the advantages and disadvantages of the approaches available in dealing with missing data.
e. Identify univariate, bivariate, and multivariate outliers.
f. Test your data for the assumptions underlying most multivariate techniques such as normality, homoscedasticity and linearity.
g, Determine the best method of data transformation given a specific problem.
h. Explain how to incorporate nonmetric variables as metric variables. i need an answer .
What is your question?
Charles
Why did you choose to use a z score of 2.5 as your criteria? Most literature suggests z score of 3.
Thanks!
Macy,
For small samples 2.5 might be a better choice, but, in any case, you can change 2.5 to 3.0. This is a user selected value.
Charles
Hello. I need help. I’m not really a pro in statistics but I need to analyze my data in the laboratory.
I have 6 treatments. My data have outliers and 2 of my treatments are not normally distributed according to Shapiro-Wilk Test.
My question is what’s my next step? I don’t know if I will continue analyzing the data thru ANOVA.
Thank you very much.
Genesis,
More important than normality is homogeneity of variances. If this assumption is not met, then often Welch’s ANOVA is a better choice than ANOVA. See
https://real-statistics.com/one-way-analysis-of-variance-anova/assumptions-anova/
Charles
Thanks Charles,
Very clear answer :), it makes sense … silly question:(.
So 2*P(z<=-2.69796) = 2*0.003488 =~0.007
But of course, we don't need to compare 0.007 to 0.0012 as 2.5 and 1.5 are only a rule of thumb, and different numbers can be used.
I assume "Tukey’s fences" method is more robust to outliers when calculating the outliers thresholds… is this a better method than the z-score method with standard deviations?
Thanks,
Oren
Oren,
Essentially, you are comparing 2.69796 with 2.5.
Each method has its advantages. The first method is really assuming a normal distribution, while the second is not.
Charles
Hi Charles,
The second doesn’t assume a normal distribution, so it is non-parametric?
Is that say the first has a stronger power for a normal distribution? while the second can handle any distribution?
Thanks,
Oren
Oren,
Both can handle any distribution, but the basis for the first is the normal distribution. Since the notion of an outlier is imprecise, I would look at both approaches as identifying data elements that need to be looked into in more detail.
Charles
Hi Charles,
When using the z-score method with +-2.5 standard deviations, the probability for natural outliers is 2*0.00621=0.01242.
When using the second method with Q1-1.5*IQR, and Q3+1.5*IQR (Tukey’s fences)
Do we know to calculate the natural probability of outliers in this method?
Thanks
Oren,
1. The probability of 0.01242 is correct provided the data is normally distributed.
2. Assuming the data is normally distributed, we know:
Q1 = NORM.S.INV(.25) = -.67449 and Q3 = NORM.S.INV(.75) = +.67449.
IQR = .67449 -(-.67449) = 1.34898
Thus, Q1-1.5*IQR = -.67449 – 1.5*1.34898 = -2.69796, and so “outliers” are < -2.69796 or > 2.69796.
Of course this approach is probably more interesting when data is not normally distributed.
Charles
Hi Charles,
thank you for you useful and very very very well done Real Stat toolò I do love it !
I have a questions about “Grubb’s Test” or “Outliers and Missing Data” test: in my case I have 30 data and I need to figure out if outliers data are present. Which test would you advice and why? I have to explain the answer to mi technical and scientific boss but I have some difficult and
fear of not being clear in the explanation.
Thank you in advance
Elis a
Elisa,
There is no right or wrong answer here. Even after using one of these techniques, you have only identified a potential outlier. You often need to use your judgement (based on your knowledge of what the data represents and the sensitivity of the statistical test that you are using to the presence of outliers) to decide whether you have a real outlier.
Personally I prefer to use the approach on this webpage (and not Grubbs test). It is easy to apply a visual, thereby making it easier to see and to explain. Also two tests are shown, one based on the normal approximation (the version on the right) and the other using IQR (namely the boxplot).
Note too that I have updated the webpage using the latest version of the boxplots, which show the potential outliers.
Charles
Very useful info and detailed even for a beginner. Thank you for the Add-In, much appreciated for ist complexity.
Is there a way to plot outliers outside the box plot? Currently the box plot includes outliers in the range.
Pandley,
So far I have not found a way to do this in Excel, except for Excel 2016 which has a built-in boxplot chart capability.
Charles
Has anyone used 2.5 instead of 1.5 as the factor to use on IQR to identify outliers
Is There a way to just reach the number of outliers with out calculating the standard data array? I mean a formula which tell us how many outliers are there in an array!
regards
Sohard,
The problem is that there are many formulas for calculating the number of outliers. Each depends on your definition of what is an outlier. E.g. if you define an outlier to be a data element that is more than 3 standard deviations from the mean, then you can use the formula:
=COUNTIF(R1,”>”&AVERAGE(R1)+3*STDEV(R1))+COUNTIF(R1,”<"&AVERAGE(R1)-3*STDEV(R1)) where R1 is the data array. Charles
Hello,
What is R1 the up mentioned? I couldn’t understand it. Thank you very much your answers.
Elcin
Elcin, sorry but I don’t what you are referring to when you say “R1 the up”.
Charles