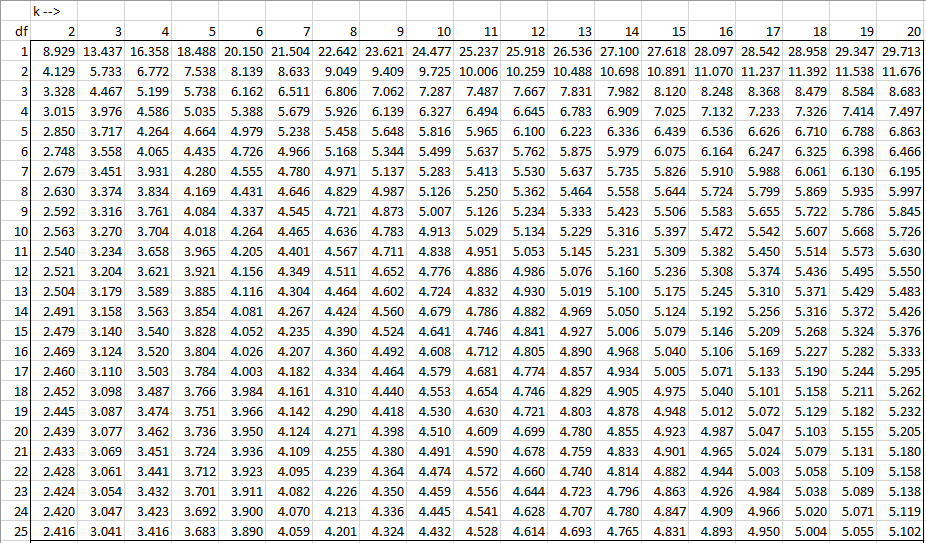
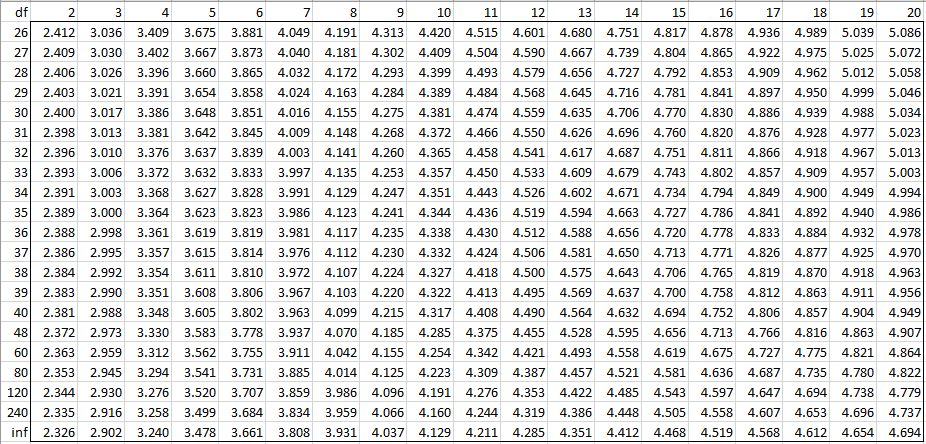
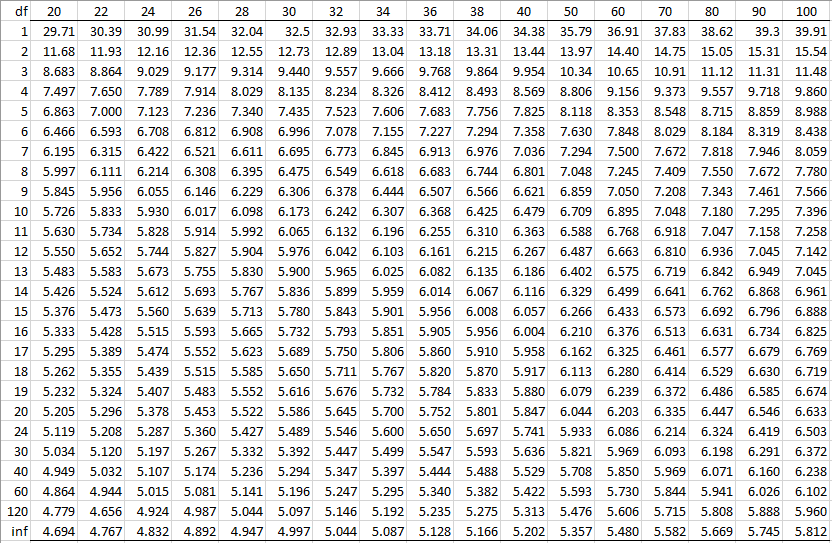
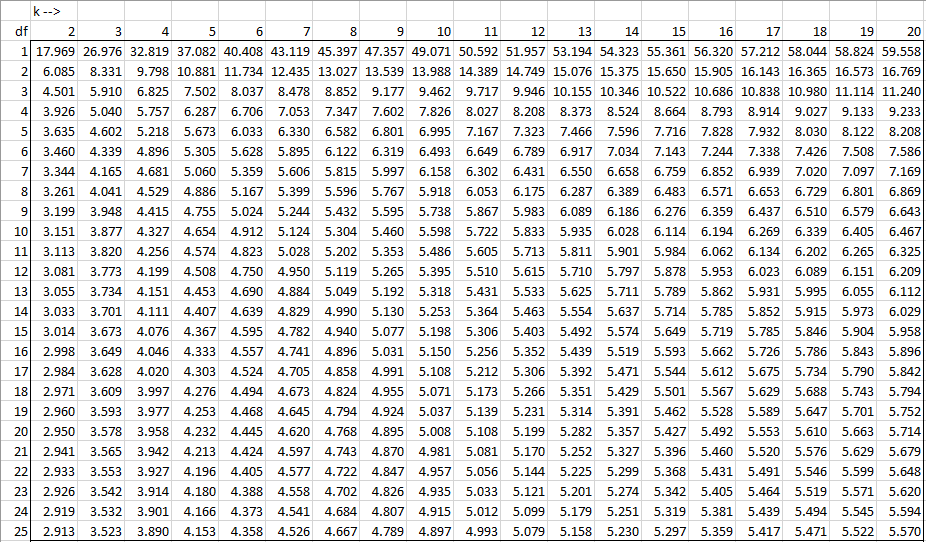
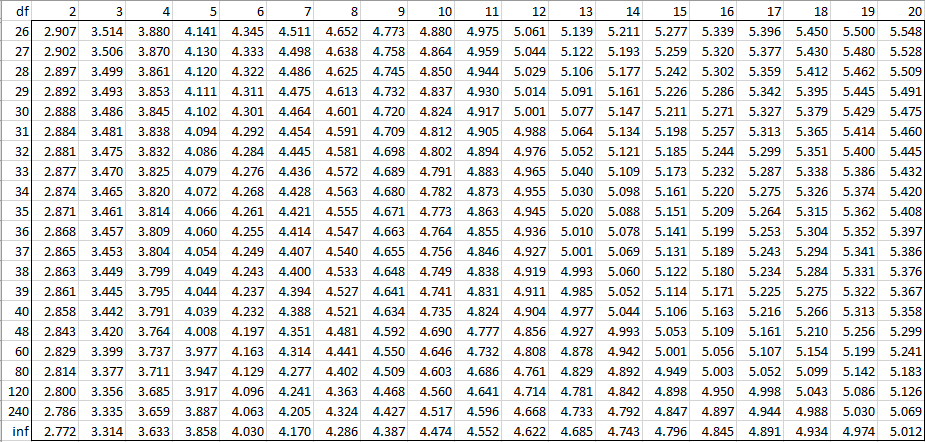
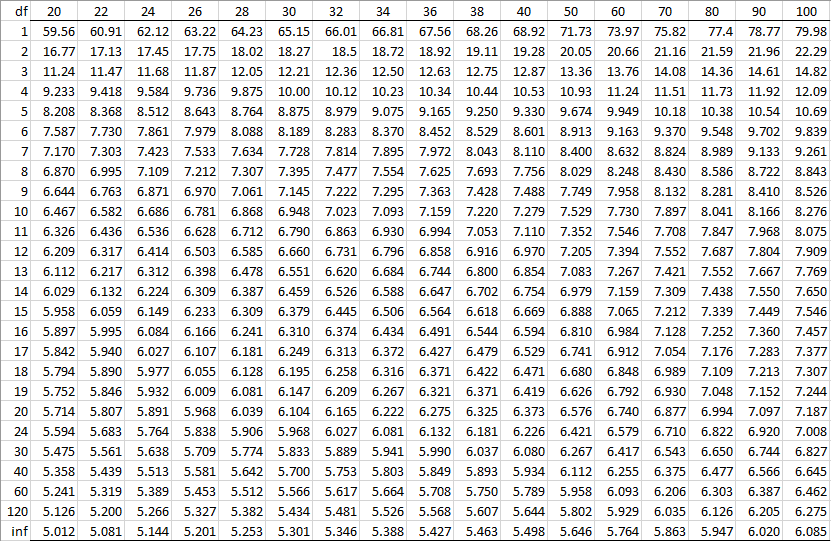
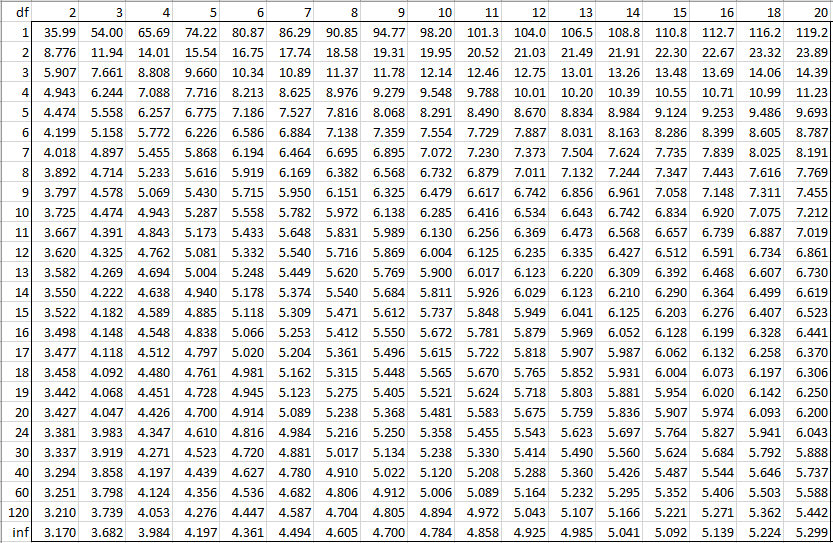
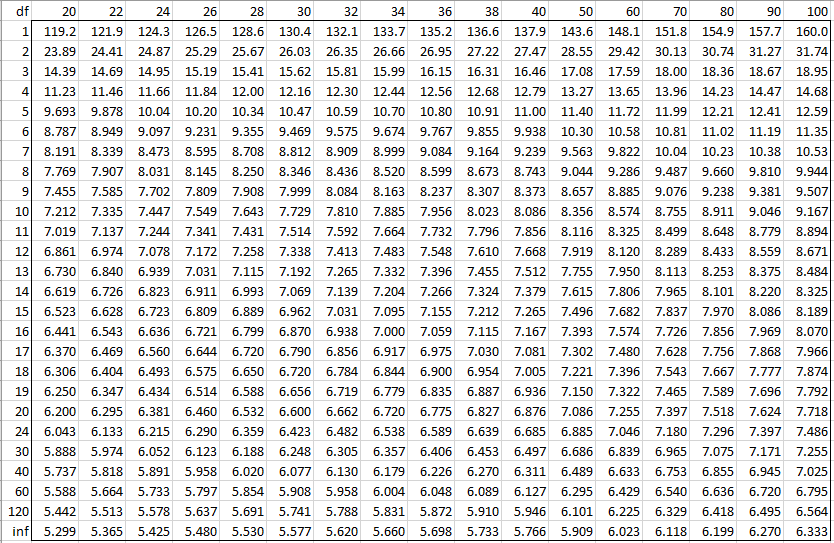
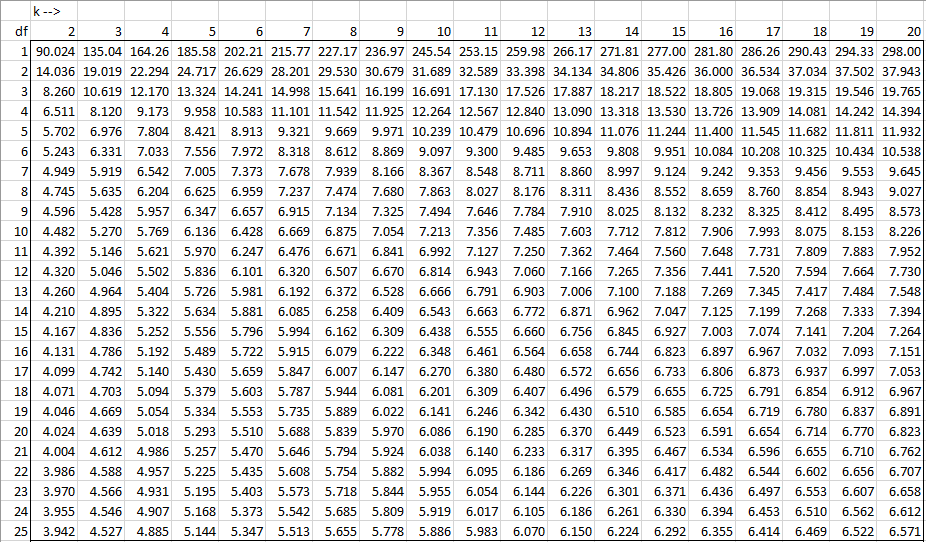
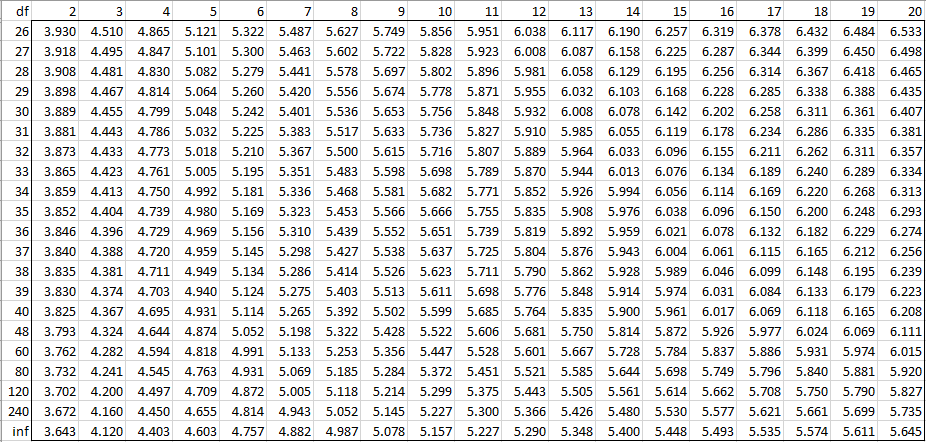
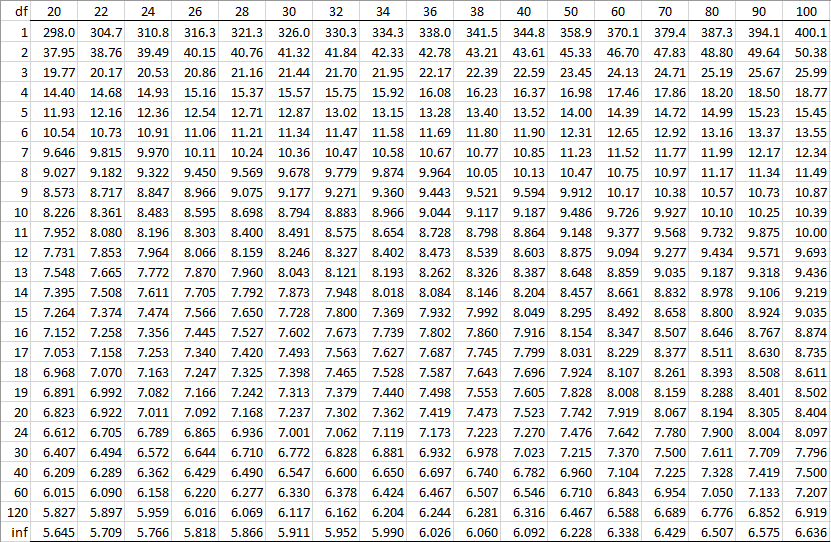
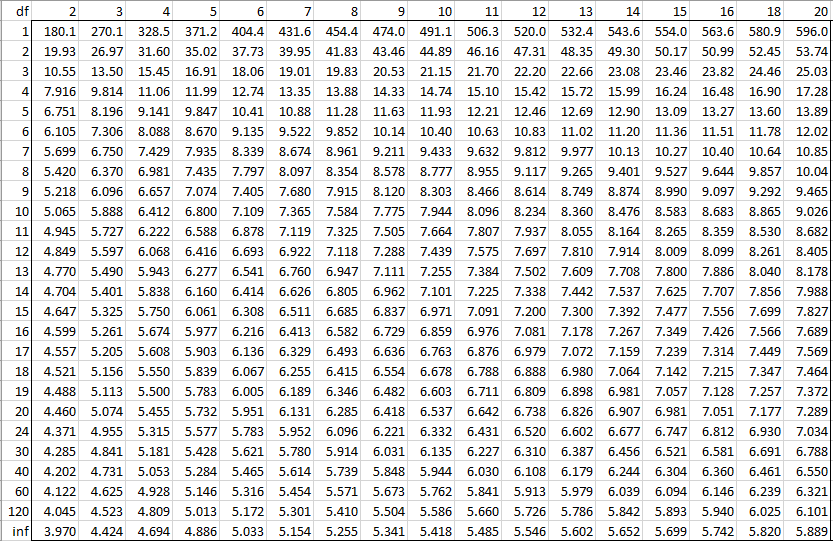
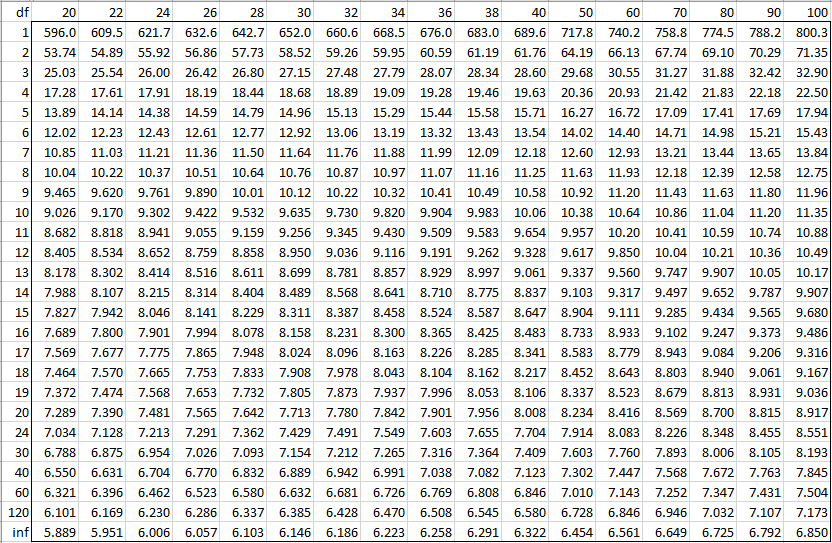
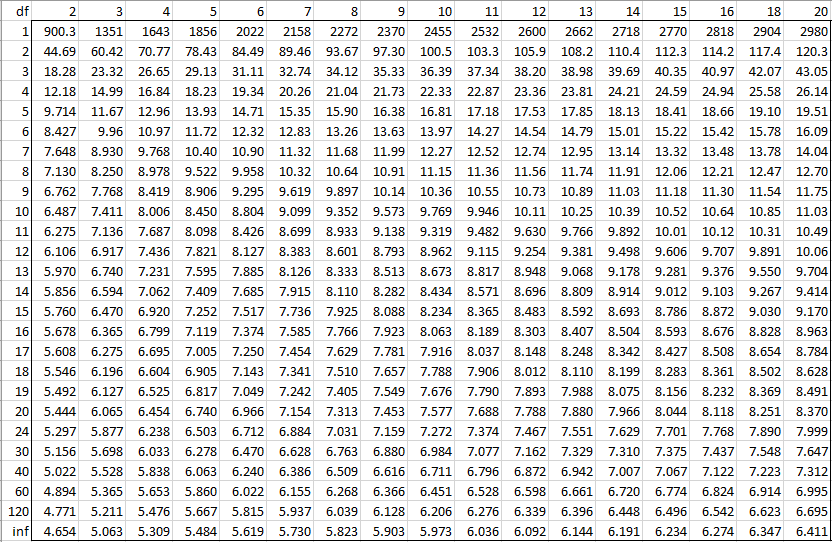
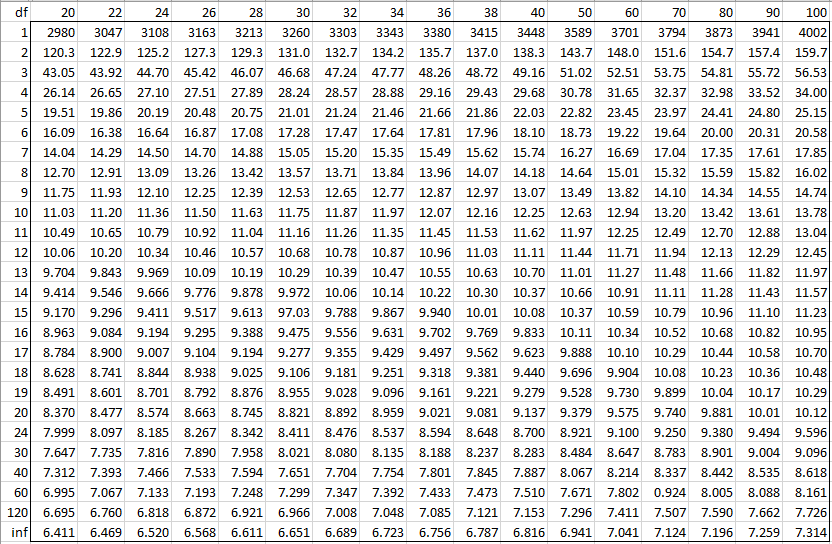
The following tables provide the critical values for q(k, df, α) when α = .10, .05, .025, 01, .005 and .= 001. See Unplanned Comparisons for ANOVA for more details.
Alpha 0.10
Alpha = 0.05
Alpha = 0.025
Alpha = 0.01
Alpha = 0.005
Alpha = 0.001
Download Table
Click here to download the Excel workbook with the above table.
References
Elvers, G. (2020) Critical values of the Studentized Range (q)
http://elvers.us/stats/tables/qprobability.html
Harter, H. L. (1960) Tables of Range and Studentized Range. Ann. Math. Statist. 31 (4) 1122 – 1147
https://projecteuclid.org/journals/annals-of-mathematical-statistics/volume-31/issue-4/Tables-of-Range-and-Studentized-Range/10.1214/aoms/1177705684.full
Zhang, L. (2018) Studentized Range distribution table. Purdue University course
https://www.stat.purdue.edu/~lingsong/teaching/2018fall/q-table.pdf
Howell, D. C. (2010) Statistical methods for psychology (7th ed.). Wadsworth, Cengage Learning.
https://labs.la.utexas.edu/gilden/files/2016/05/Statistics-Text.pdf
How do the different alpha levels (e.g., 0.10, 0.05) affect the critical values in the table, and what implications does this have for hypothesis testing?
Regard Administrasi Bisnis
You can see from the tables how the alpha levels affect the critical values. These tables tend to be used for follow up testing after a significant ANOVA result. The larger the alpha level the more significant post-hoc test results.
Charles
Hello,
You can clearly see that the smaller the alpha level, the larger are the critical values.
Thus, the smaller the alpha value the more difficult to obtain a significant result at that significance level.
Charles
Hello Charles,
I download the XRealStats add-in; I wonder whether we can use the tool to find q value directly, is there any function I can apply?
Hello Rative,
You can use the QDIST or QPROB function as described at
https://real-statistics.com/one-way-analysis-of-variance-anova/unplanned-comparisons/tukey-hsd/
Charles
Hello Charles,
I downloaded your Excel file with the Studentized range tables to compare against mine (I did not install the add-in). I noticed a few discrepancies in the sheet “Stud. Q Table 2”, top table with alpha=0.01: For k=3, df=19, the table shows 1.670 when it should be 4.670. Also, for k=13, df=14,…,30, the table shows 5.xxx when it should show 6.xxx. The same values ARE correct in the last table of the sheet “Stud. Q Table 1” also for alpha=0.01.
Hello Amanda,
Thanks for catching this error.
I have now made the corrections on the attached table.
Fortunately, the values reported by the Real Statistics software were correct.
I really appreciate your help in improving the accuracy of the website.
Charles
Hi there Charles,
I have the XRealStats-Mac package downloaded and have ticked the solver and XRealStats add-in on my current excel workbook but the QDIST and QCRIT functions don’t seem to be there ? any workarounds at all ?
thank you !
Hi Amy,
What do you see when you enter the formula =VER() in any cell?
Charles
use of Sig. 0.05, 0.025, 0.001 based on what? based on need or up to us?
I’m still confused why the app by default uses 0.05
Please help me
In some sense, these values are arbitrary, especially the default of alpha = .05. Probably .05 was chosen since it means that a wrong outcome occurs 1 time out of 20, and this was viewed as acceptable.
Charles
I am using these tables with the df of the WG (Error). Is that the correct df to use?
Michelle,
I don’t know what the WG(Error) means. The df for the error term is the one used in the table.
Charles
Dear Charles,
I am enjoying and learning a lot from your website. From this table, it is clear to me that the q statistic is related to t statistic in that q=t*squared root of 2. However, it only applies for the first column (k=2). My question is whether there is a relationship between the t statistics and the other columns (k>2), so that we can use the t table instead if this table. Thank you in advance for your reply.
Regards,
Wilson Fandino
Wilson,
You can’t replace the studentized q range distribution by the t distribution.
Charles
Hi,
This is a great resource! Couple operational questions I had:
1) Is there a form of this Studentized Q table somewhere in a copy-able grid or excel? I only found this one but the values are different: http://elvers.us/stats/tables/qprobability.html
2) More important question :-). Is there a table anywhere where I can manually get the corresponding P VALUES calculated based on any given Qstat (without using the Qdist plugin)? How could i best go about this would that formula?
Hi Thomas,
1. The ANOVA 1 examples workbook contains the same Studentized Range q values that you see on this webpage, but in Excel format (and therefore copyable format).
You say that the values are different from the ones in http://elvers.us/stats/tables/qprobability.html. The values on this webpage don’t include entries for 41-47, 49-59, 61-79 and 81-119. Can you give me one or two examples outside of these ranges where the values on the Real Statistics website and this found in the table that you referenced in your comment?
2. I have not found a table with the p-values. Instead, for Real Statistics, these values are calculated via a program in the software. The results are returned by the QDIST function. You can use this function to create the table that you are looking for.
Charles
Charles
Hi do you have duncan table for 21-25 p range?
Bele,
See http://pba.ucdavis.edu/files/45010.pdf.
You will need to use interpolation for p = 21 to 25.
Charles
How to determine the q in HSD (TURKEY’S) ?
See https://www.real-statistics.com/one-way-analysis-of-variance-anova/unplanned-comparisons/tukey-hsd/
Charles
Dear professor.
Thanks a lot the table is quite clear .
dear prof
how to calculate the critical value of SSR(Duncan’s) distribution using the qinv fuction you supplied?
thank u very much.
Hello,
Real Statistics doesn’t support Duncan’s post-hoc test. See the following for details about how to use the q-crit value for this test:
https://en.wikipedia.org/wiki/Duncan%27s_new_multiple_range_test
Charles
thank u ,dear prof.
Duncan’s Multiple Range Test DMRT still valid. If yes, its formilar
Tok,
You can use the DMRT, but some have criticized the test as being too liberal. Tukey’s HSD is commonly used instead and so I have focused on this test instead of DMRT.
Charles
Can you send or show a tuky table at the 0.001 level?
Huda,
The referenced webpage includes the table for alpha = .001.
Charles
Hi Charles,
Hi Charles,
I’m sorry to insist so much on Tukey’s HSD, but I really want to understand.
Does what you wrote mean that Tukey’s HSD is not set up to compare say the group with the second smallest mean with say the group with the third largest mean?
The point is that after having made an analysis of variance, and found that there is, at least one significant difference among the means, it is essential to find out which of the various differences among the means may be statistically significant. One thing you know for sure (at a given level of confidence) and that is that there may be significance between the smallest and the largest mean…
So what to do if you want to calculate the smallest difference that should exist between two significantly different means since Fishers LSD’s error rate becomes too high for more than three (I read) means?
The answer to this question needs to show a fine balance between reliability and precision, I feel.
Thank you once more for your precious time,
Erik
Hi Erik,
Tukey’s HSD will identify a significant difference between any two groups, not just the smallest mean with the largest. The way it reduces experimentwise error is based on the difference between the largest and smallest means, but this is perhaps a detail that you may not find that important.
Charles
Hi Charles,
1. I found in my wine tastings Tukey’s HSD test being so severe that it often makes conclusions disappointing at 95% of confidence level. As I wrote to you I believe a one sided test is applicable since all differences between means are positive, would you aggree with that? I really am interested to know weather your tables refere to a one tailed test or not. If they were two sided one could use de 90% tables and have a confidence level of 95%
2. Why do you not support Fisher’s LSD test? Is it because it uses the Residual Variance and a t-value while HSD uses the Within Wines Variance and a q-value? For my wine tastings it gave mostly plausible, say “believable” values. But is gut feeling of course.
Thank you sincerely for answer,
Erik
Hi Erik,
1. As I just wrote to you, I believe that Tukey’s HSD is a two tailed test.
2. I don’t support Fisher’s LSD since it doesn’t handle experimentwise error rate very well. Tukey’s HSD is much better at this.
Charles
hello. may i ask?. How can be the q critical value be computed without depending on the Duncan’s distribution table? Is there an existing formula that can be used? what is it? thanks for your response 🙂
Carlo,
You can compute the q critical value by using the QINV worksheet formula supplied by the Real Statistics Resource Pack, as described on the following webpage>
https://real-statistics.com/students-t-distribution/studentized-range-distribution/
The resource pack can be downloaded for free from the website.
Charles
I downloaded the package…but the QINV or QCRIT is not available…
Carlo,
What version of the software are you using? The Mac version?
Charles
I’ve had this same issue, I have the Excel 16.58 version on Mac, I’ve made sure that both the Solver add-in and the XRealStats-Mac add-in are ticked but the QCRIT or QDIST functions don’t seem to be there ?
Hi Amy,
What do you see when you enter the formula =VER() in any cell?
Charles
Hi Charles,
I have been trying to come to a better understanding of Tukey’s HSD and wonder if you can aggree with what I wrote hereunder:
Given a panel of n judges scoring each of k wines means X1, …, Xi, … Xk were found.
After sorting those means from largest to smallest, the test hypotheses for the k(k-1)/2 differences are:
Ho: mu-i minus mu-j = 0
H1: mu-i minus mu-j larger than 0, and not “different from zero” like I found on some sites.
So reject Ho if Xi – Xj >= q-alpha*S-w/square root n, seems to me being a one-sided test. Is this correct ? Is your table 3 made up in that sense ?
Thank you very much, this is a brillant site,
Erik
Erik,
I am very please that you like the site and I appreciate your calling it “brilliant”.
I believe that Tukey’s HSD is a two-tailed test and not a one-tailed test.
The reason for the sorting that you refer to is that the test is essentially set up to compare the group with the smallest mean with the group with the largest mean.
Charles
good day. i have this little question. How can be the q critical value be computed without depending on the tukey’s distribution table? Is there an existing formula that can be used? what is it? thanks for your response 🙂
The Real Statistics Resource Pack provides the QINV function which calculates the critical values. See the webpage
Studentized Range Distribution
Charles
How can i get the critical value if my df=42 and n=3, with alpha=0.05? I can see 40 and 60 but I don’t know how I can get the exact value for that? What is my critical value then? Thanks!
Iris,
I can offer you two choices:
(1) interpolate the values in the table between the values for 40 and 60. Since 42 is a lot closer to 40 than 60, the appropriate value should be closer to the value in the table for 40.
(2) Install the Real Statistics Resource Pack. You can then use either the QCRIT or QINV function. QCRIT will do the interpolation for you and QINV will directly calculate an estimated value for df = 42.
Charles
Are these tables also applicable to games-howell post hoc tests?
Currently my df values are below 4 and a similar table I found only went to 5 as a minimum, which proved hard finding the correct Q value.
If so, when choosing the the Q value for example if the df was 4.65, would 4 or 5 on the table be most accurate?
I understand with games howell, you must first calculate the df, between each pair, followed by the qcrit value for each pair, before using in the final equation (see link): http://www.unt.edu/rss/class/Jon/ISSS_SC/Module009/isss_m91_onewayanova/img138.png to get the minimum significant difference.
Can someone please confirm if this equation is correct?
I followed the guidelines from this website: http://www.unt.edu/rss/class/Jon/ISSS_SC/Module009/isss_m91_onewayanova/node7.html
However in the final calculation of minimum significant difference for games howell, (down the bottom of the webpage) I noticed in place of their qcrit, they used the calculated df value instead, despite in the formula saying q crit. I wonder if this is a mistake, or if this is what one is meant to do.
Any guidance would be greatly appreciated and if anyone has a better calculations example for games-howell please share.
Warm regards, Jess
Jess,
Yes, these tables are applicable to Games-Howell. If your df is between 4 and 5 you can interpolate between the values in the table.
Sorry but I haven’t had time to look at the references you provided regarding your other questions.
Charles
Dear Charles,
Thank you kindly for that!
I have since downloaded the program onto my mac and have attempted to use QCRIT formula, however every time I type the function with the values, separated by commas, it shows up as #NAME and says ‘compile error in module: look up’.
Any guidance please?
Apologies the message is #VALUE!, not name that shows up.
Jess,
I have just checked on my Windows.based computer and the QCRIT function works fine. I can’t think of any reason why it wouldn’t work on the Mac, but
unfortunately, since I don’t own a Mac I can’t test the QCRIT on the Mac until the next time I borrow a Mac from a friend. In any case, you can try to use the QINV function which estimates the value of the inverse Studentized Range value without doing a table lookup.
Charles
Thank you for your service! I am interested to known about ANOVA post-hoc Q test. Is it possible to run this test for more than 20 treatments (groups)? Where do I get a Q table that provides values for a>20? Can I calculate table Q value? How? Is there an “infinite a” Q value? Will you please help me?
Gurumani,
The Real Statistics Resource Pack provides the function QINV(p, k, df, tails) which calculates the table value for any value of k (= # of groups), even for k > 20. The values of Q for infinite df are given in the table on the referenced webpage. You can download the Real Statistics Resource Pack for free from the website.
Charles
what mean of tukey HSD and tukey-b
I don’t understand your question. Please explain further.
Charles
thanks a lot prof. i can finish my task about this :).
Can someone please tell me what the Q statistic is for alpha=0.05, df=156 and k=4? I can’t find it in the reference table.
Sarah,
You would need to interpolate between the table values for df = 120 and df = 240. Q-crit for df = 120 is 3.685 and the Q-crit for df = 240 id 3.659. A linear interpolation would give the value 3.6772, which can be calculated using the Real Statistics formula =QCRIT(4,156,0.05,2).
The Real Statistics formula =QINV(0.05,4,156,2), which does not use the table, will usually give a more accurate answer, which in this case is 3.6726.
Charles
Second group of q tables 0.01 k=40
thanks
This comes from reference [Ha] on the Bibliography webpage of the Real Statistics website.
Charles
how found Second group of tables 0.05 k=40
thanks
This comes from reference [Ha] on the Bibliography webpage of the Real Statistics website.
Charles
how can i get df 45, i can only see 40 and then 60. thanks
You have to interpolate. E.g. if the table value for 40 is .2 and the table value for 60 is .4 then the value for 45 would be .25.
Alternatively you can use the QCRIT or QINV functions provided in the Real Statistics Resource Pack which carry out this work for you. See the webpage https://real-statistics.com/students-t-distribution/studentized-range-distribution/.
Charles
Can anyone please tell me what the Q statistic is for alpha 0.05, df 75 and k 23? I have not found it in any reference table.
These are outside the range of values found in the table. You can use the Real Statistics Resource Pack’s QINV function to find the approximate value. The formula =QINV(0.05,23,75) gives the value 5.306308907. More details can be found at https://real-statistics.com/students-t-distribution/studentized-range-distribution/.
Charles
hello
Can you please tell me what the Q statistic is for two way anova (25×2), alpha 0.05, and df 200 ? Thx 😀
I don’t know of a q statistic for two-way Anova. The q statistic is used in various Anova follow-up tests (e.g. Tukey HSD). These are described elsewhere on the website, but they apply to one-way as well as two-way Anova, although perhaps you are referring to some test that I am not familiar with.. For more information see https://real-statistics.com/one-way-analysis-of-variance-anova/unplanned-comparisons/ and https://real-statistics.com/two-way-anova/contrasts-two-factor-anova/.
Charles