Basic Concepts
We now consider an experimental design to determine whether there is a difference between two groups within the population. For example, suppose we want to test whether a new drug is effective in treating cancer. One approach is to create a random sample of 40 people, half of whom take the drug and half take a placebo. For this approach to yield valid results it is important that people be assigned to each group at random. Such samples are independent.
When the population variances are known, hypothesis testing can be done using a normal distribution, as described in Comparing Two Means when Variances are Known. However, population variances are not usually known. The approach we use instead is to pool the sample variances and use the t distribution.
We consider three cases where the t distribution is used:
- Equal variances
- Unequal variances
- Paired samples
We deal with the first of these cases on this webpage.
Key Property
Property 1: Let x̄ and ȳ be the sample means of two sets of data of size nx and ny respectively. If x and y are normal, or nx and ny are sufficiently large for the Central Limit Theorem to hold, and x and y have the same variance, then the random variable
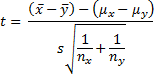
has distribution T(nx + ny – 2) where
![]()
s, as defined above, can be viewed as a way to pool sx and sy, and so s2 is referred to as the pooled variance. Also, note that the degrees of freedom of t is the value of the denominator of s2 in the formula given in Property 1.
Proof: Click here for a proof of Property 1.
Worksheet Functions
Real Statistics Functions: The Real Statistics Resource Pack provides the following worksheet functions.
VAR_POOLED(R1, R2) = pooled variance of the samples defined by ranges R1 and R2, i.e. s2 of Property 1
STDEV_POOLED(R1, R2) = pooled standard deviation of the samples defined by ranges R1 and R2, i.e. s of Property 1
STDERR_POOLED(R1, R2, b) = pooled standard error of the samples defined by ranges R1 and R2. This is equal to the denominator of t in Property 1 if b = TRUE (default) and equal to the denominator of t in Property 1 of Two Sample t Test with Unequal Variances if b = FALSE. When the sample sizes are equal, b = TRUE or b = FALSE yields the same result.
Each of these functions ignores all empty and non-numeric cells.
t-Test using Property 1
Example 1: A marketing research firm tested the effectiveness of a new flavoring for a leading beverage using a sample of 22 people, half of whom tasted the beverage with the old flavoring and the other half who tasted the beverage with the new favoring, although one person dropped out of the study before the tasting began. The people in the study were then given a questionnaire to evaluate how enjoyable the beverage was. Based on the scores shown on the left side of Figure 1, determine whether there is a significant difference between the perceptions of the two flavorings.
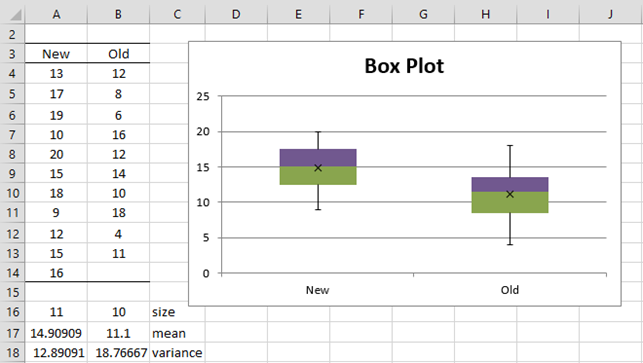
Figure 1 – Data and box plot for Example 1
As we can see from Figure 1, the mean score for the new formula is 14.9, while the mean score for the old formula is 11.1, but is this difference just due to random effects or is there a statistically significant difference?
We also note that the variances for the two samples are 12.9 and 18.8. It turns out that these two values are close enough to satisfy the equal variance assumption.
Finally, when we draw the box plots for the two data sets we see that each is relatively symmetric (i.e. for each sample, the colored areas in each box are approximately equal in size and the upper and lower whiskers are fairly equal in length).
Thus, the assumptions for the t-test are met, and so we can carry out the test using the following null hypothesis:
H0: μ1 – μ2 = 0; i.e. there is no difference between the two flavorings (two-tailed test)
Since the sample variances are similar we decide that the population variances are also likely to be similar and so apply Property 1.
![]()
and so s =
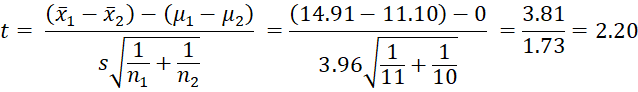
![]()
Since p-value = T.DIST.2T(t, df) = T.DIST.2T(2.20, 19) = .04 < .05 = α, we reject the null hypothesis, and conclude there is a significant difference between the two flavorings. In fact, the new flavoring is significantly more enjoyable.
Note that VAR_POOLED(A4:A14,B4:B13) = 15.67, STDEV_POOLED(A4:A14,B4:B13) = 3.96 and STDERR_POOLED(A4:A14,B4:B13) = 1.73.
Data Analysis Tool
We can also carry out the t-test for Example 1 by using the following Excel data analysis tool.
Excel Data Analysis Tool: Select Data > Analyze|Data Analysis and then choose the Two-Sample Assuming Equal Variances option from the dialog that appears. Next, fill in the dialog box that appears as shown in Figure 2.
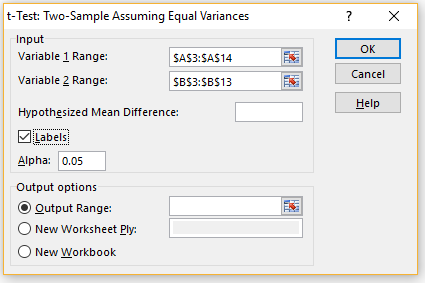
Figure 2 – t-Test dialog box
After pressing the OK button, the results shown in Figure 3 appear.

Figure 3 – Data analysis tool output
Note that the results are the same as those calculated by hand.
Real Statistics Data Analysis Tool
The Real Statistics Resource Pack also provides a data analysis tool that supports the two independent sample t-test, but provides additional information not found in the standard Excel data analysis tool. Example 3 in Two Sample t Test: Unequal Variances gives an example of how to use this data analysis tool.
Another Example
Example 2: To investigate the effect of a new hay fever drug on driving skills, a researcher studies 24 individuals with hay fever: 12 who have been taking the drug and 12 who have not. All participants then entered a simulator and were given a driving test that assigned a score to each driver as shown on the left side of Figure 4.
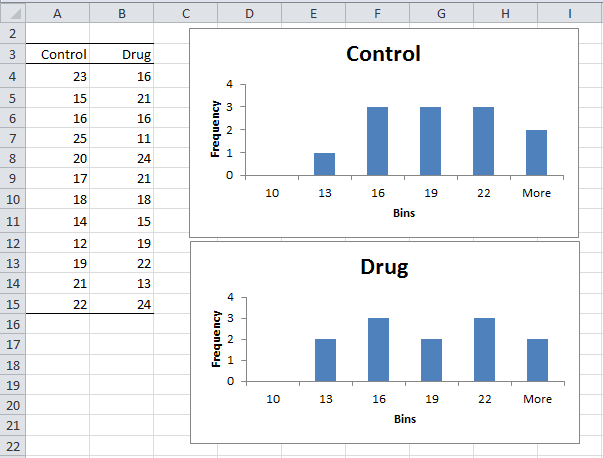
Figure 4 – Sample data and histograms for Example 2
Checking Assumptions
As in the previous example, we plan to use the t-test, but especially with a sample this small, we first need to check that the data are normally distributed (or at least symmetric). The shape of the histograms on the right side of Figure 3 is not too far off from that of a normal distribution. Also, the variances are relatively similar (15.18 and 17.88), and so we can again use Excel’s t-Test: Two-Sample Assuming Equal Variances data analysis tool to test the following null hypothesis:
H0: μcontrol = μdrug
Click here for more information about the test assumptions.
Analysis Results
The results are shown in Figure 5.

Figure 5 – Two sample data analysis results
Since tobs = .10 < 2.07 = tcrit (or p-value = .921 > .05 = α) we retain the null hypothesis; i.e. we are 95% confident that any difference between the two groups is due to chance.
Confidence Interval
The confidence interval for the difference between the two population means is defined in a similar manner as in the one-sample case, namely
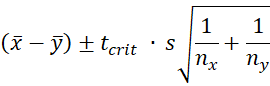
where s is as in Property 1.
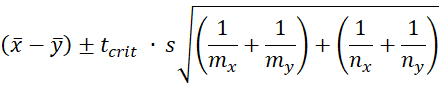
Prediction Interval
If new samples are drawn from the two populations of size mx and my, then the prediction interval for the difference between the new sample means is
Effect size
Click here for a description of Cohen’s d and Hedges’s g effect size measures for the two-sample t-test. In addition, an estimate of the confidence interval for Cohen’s d is provided.
Examples Workbook
Click here to download the Excel workbook with the examples described on this webpage.
References
Howell, D. C. (2010) Statistical methods for psychology (7th ed.). Wadsworth, Cengage Learning.
https://labs.la.utexas.edu/gilden/files/2016/05/Statistics-Text.pdf
Nelson, S. L. and Nelson, E. C. (2016) How to use the t-test data analysis tool in Excel
https://www.dummies.com/article/technology/software/microsoft-products/excel/how-to-use-the-t-test-data-analysis-tool-in-excel-152093/
Can the test be used if the population size differs between the two groups? All examples have the same size?
Yes, the two independent sample t-test can be used with samples of different sizes.
Charles
Hi Charles, Can you help me with this problem. I tried to answer but not sure if its correct. I need clarification. Thank you in advance.
Is there any difference in the standard deviation of the mean result obtained by the following plans: taking the average of 5 analyses of 5 samples or mixing the 5 samples and making one analysis of the combined sample (assuming equal variance of analysis on both sample sizes)? Find the standard deviation of the mean(s) for a case with a variance of the sampling of 0.12 and variance of the analysis of 0.066.
Hello Ramon,
1. Regarding “Is there any difference in the standard deviation of the mean result obtained by the following plans: taking the average of 5 analyses of 5 samples or mixing the 5 samples and making one analysis of the combined sample (assuming equal variance of analysis on both sample sizes)?”, I suggest that you create data for 5 samples with say 10 elements each and see whether there is a difference for this example.
2. Use these samples to try to answer the second question.
Charles
Hi Charles
I have a data set of two independent groups i.e. Male and female, and I measured a quantity Say X in both of group. Along with X we also measured the weight of each individual. Would two sample t test be an appropriate choice to compare variance among male and female for the quantity X ( or if quantity X is significantly different between two ?) Also I am wondering how can i use the ‘weight’ in this statistical analysis ; as i want to know if difference in the quantity X for both male and female population is independent ( or depend ) on the weight ?
Thanks a lot for your time and help
See my response to your previous comment.
Charles
Hi Charles, I have a data set with two groups (male and female, each n=16 ), where we measured a quantity say ‘X’ in both male and female. Also i recorded weight for each male and female participant as well. I am wondering which statistical test will be appropriate to compare the two groups for quantity X? (My guess is 2 sample t test should work )
How can i make sure that variation of X in two group is either dependent or independent of weight ? Which statistical test can be used to ensure this?
I appreciate your help and time.Thanks
Hello Sally,
Provided the assumptions are met (e.g. normality), the two independent sample t-test is appropriate.
If the weight is characterized as say Over-weight, Normal, Under-weight, then you can use two-factor ANOVA with Gender and Weight as the two factors. If you just look at weight as a numeric value, you can use regression.
Charles
Hello Charles, very informative article.
I need to compare two models run on the same sample of ~8000 and I calculate error for both of them (predicted vs actual). I want to prove that my new model performs better than the old model. Here are the stats. Is it advisable to use two sample T test with equal variance? I get different outcomes when I use two sample T test with equal variance vs Paired two sample test.
New model Old model
Mean absolute error 101080 102602
Std dev of abs error 104418 109470
Not sure which is one relevant. Appreciate your help.
Thanks,
Yash
Since the two models are run on the same sample then the paired t-test is the appropriate test (assuming the differences are normally distributed or at least symmetric).
Charles
Suppose we have two samples and we want to know whether they were drawn from populations where the variances are equal. Sample 1: n=41, S square=25; Sample 2: n=61, S square=30, what is the best conclusion for these data? F60,40,0.025=1.8
David,
If you are testing equality of variances (and not equality of means) then see
https://real-statistics.com/chi-square-and-f-distributions/two-sample-hypothesis-testing-comparing-variances/
Charles
Hi Charles
Hope you are well.
I am doing a course and we have been asked to run a 2 independent samples t test. The research question is whether employees below the age of 35 are more innovative than those above the age of 35. So, the DV is innovation and the IV is age.
I ran a 2 sample t test using the real stats function, but seem to be getting different results from what they are doing with SPSS on the course.
Question 1. I have categorised the ages into 0 and 1 values, 0 being below 35 and 1 being 35+. Is this accurate?
Question 2. In the input ranges, is input range 1 or 2 for the the IV?
Hi Dennis,
I have done extensive testing of the Real Statistics t test capabilities and they match those from SPSS. I would appreciate it if you would send me the case where the results don’t match so that I can see why this is so.
Q1. This certainly one way of doing things
Q2. This really depends on the type of data you have, i.e. how you measure innovative.
Charles
Hi Charles
Emailed the stats over to your gmail account.
Thanks
Dennis
Hi Dennis,
I have not yet received your email.
Charles
I am creating a hypothetical research project and am working with two groups ideally of equal size one receiving a specific treatment and the other not. The measurement tools I will be using is the BWAT wound measurement tool and laboratory values to measure the amount of healing and eradication of infection. My question is which statistical test should I use to help measure and answer the question of whether the treatment is statistically significant?
Hello Adrienne,
If I understand correctly, you should be able to use a two sample t test provided the assumptions (esp. normality) are met.
Charles
Thank you!
Good day sir,
I would like to know if there is a significant difference between the recorded means of 225 patients whose CAT Scan images were registered automatically and manually.
I decided to use the t-test : Two-sample Assuming Equal Variances.
Is this the right choice for me???
This can be the right choice if the patients whose CAT scans were registered manually are different from the patients whose CAT scan images were registered automatically. Otherwise, you are probably looking at the paired t test.
Also the normality and equal variance assumptions must be met.
Charles
hi, i want to know if we want to run a t-test by using data between male and female.what t-test should we use.
Hello Nana,
Probably two independent sample t test unless the males and females are pairs of related individuals (e.g. husband and wife or brother and sister).
Charles
Hii..I have 3 data one is normal value of a patient other is value after putting one eye drop (group 2) and other data is putting other eye drop(group 3)..I need to compare normal with group 2 and again normal data with group 3 and then between group 2 and group 3.. please suggest me how to calculate p value for each
Hi! I hope someone would be able to notice me hehe. I have a math project and we need 10 examples and solutions for hypothesis testing on t-test with equal variance. I can’t find any so please help me out. 🙁 This would mean a lot to me. Thanks a lot in advance!
Hi Lei,
You can simply make up the numbers for two samples and run the t test as described on the website to get the solutions. This is a reasonable approach unless you need real data from a real study, in which you could find these by googling, although, as you probably know, there is a lot of work involved to find suitable examples.
Charles
How do i change 1.7E-25 into easier number
Hello Manju,
This is 0.00000000000000000000000017 (i.e. move the decimal position 25 places to the left)
For most purposes, you can assume that this value is zero.
Charles
This means that p value is significant?
Hello Radhika,
The test for Example 1 is significant. The test for Example 2 is not significant.
Charles
Hi Charles,
Thank you for saving my career with your wonderful knowledge you shared here. I am dealing with a strange situation which I hope you can come up with a solution.
I have 3 pared group(n=7 for each) which I tried to see if they are significantly difference and if so, in which pairs. The means for Groups (G1-3) are 33.01, 31.20, and 22.93 respectively. The variances are 129.10, 116.56, and 75.12.
To test the normality, I used Shapiro-Wilk and d’Agostino-Pearson test together with Box plot. I have 1 outlier in G2 and G3 according to QQ plot (although Outliers in ANOVA, explained here: https://real-statistics.com/one-way-analysis-of-variance-anova/outliers-anova/ did not find any outliers with Alpha=0.02) and both normality tests were negative for G3. The Levene’s Tests (3 types) show that the 3 groups show that p value>0.5 (actually all of them are p>0.5) which I concluded that the samples are homogeneous (I’m not sure how it would work with the outliers).
Anyhow, because the assumptions for ANOVA were not met completely, I did 2 things and compared the results:
1- I ran the same tests on LOG10 of my data and the results are as follows:
Means for G1-3: 1.50, 1.47, and 1.34 and variance is 0.020, 0.021, 0.018 respectively.
This time, only d’Agostino-Pearson test for G3 was p0.8 (homogeneous data) and the Box and Whisker diagram showed an outlier in Log G3. So my first question is if I running one way ANOVA would be recommended? Anyhow, I did the run the one way ANOVA (assuming that the variances are close enough) and p-value>0.05 for 3 groups. I ran post hoc Contrast test and by setting c=1 for Log G1 and c=-1 for Log G2 (combination of Log G1- Log G3) , the result is ‘slightly’ significant (p=0.0498) but other compbinations show no significance. This didn’t repeat when the p-value for Tukey HSD tests were >0.05 for all 3 combinations of Log (G1-G2, G1-G3 and G2-G3). I ran non-parametric Schaich-Hamerle and Kruskal-Wallis tests followed by Contrast KW and the results of all of them are insignificant. Logically we should assume that the groups are equal and we don’t need to run the paired tests but because the mean of G3 is lower than 2 others and that the Contrast test for ANOVA was insignificant for G1-G3, I ran two paired samples t-tests and Wilcoxon Signed-Rank Test for Paired Samples between each 2 groups and surprisingly the results are as follows:
T-test:
Log G1-Log G2: Insignificant
Log G1-Log g3: Significant
Log G2-Log G3: Significant.
Exactly the same results were achieved with Wilcoxon Signed-Rank Tests for Paired Samples. How can I explain this?
______________________________________
2- With the raw data with outliers in G2 and G3 and failed normality results in G3, I ran non parametric Kruskal-Wallis follows by Schaich-Hamerle Test and Contrast KW tests. Also I ran Welch’s Test and the result of all of the tests and post hoc test were insignificant. I even ran the resampling ANOVA test on 3 groups (bin size=0.5, Bins 0-6,Bootstrap, Iterations=10000) and p value>0.05, meaning that the samples are equal in their means. But out of curiosity, again I ran two paired samples t-tests and Wilcoxon Signed-Rank Test for Paired Samples between each 2 groups and while I expected not significance, the exact same results as was achieved with the Log values was attained:
T-test and Wilcoxon signed-rank tests results :
G1-G2: Insignificant
G1-G3: Significant
G2-G3: Significant.
Can you help me why the global tests (ANOVA and Kruskal-Wallis) contradict the post hoc paired tests and which one I should trust and report as my result?
Is it possible to get a ‘significant’ result from a multiple comparisons test even when the overall ANOVA was not significant?
THANK YOU SO VERY MUCH IN ADVANCE,
Hadi
Forgot to tell that before running the paired tests, the F tests were in significant for all the pairs and on both ras and Log data.
Thanks!
Hadi
Hadi,
Glad the Real Statistics website has been so helpful to you.
1a. ANOVA is pretty robust to violations of normality as long as the group sizes are equal (or very similar). You said that you have one outlier in G1 and G2. Do you know the reason for having these outliers? With large samples there are bound to be elements that are tagged as “outliers”, but this doesn’t necessarily mean that there is a problem. Does SW still find that G1 and G2 are normally distributed?
1b. When you say that normality tests were negative for G3, does this mean that G3 failed the normality tests? From the box plot does it look like this sample is symmetric?
1c. The most important assumption for ANOVA is the homogeneity of variances assumption. From your comment I understand that this assumption is met. If you have concluded that ANOVA is not appropriate then you can use a transformation (as you have done) or you could use Kruskal-Wallis test (as you have done) instead (given that the group variances are approximately equal). What is most important is that you don’t find yourself trying a lot of different tests, looking for one that gives a significant result. This is not good science.
1d. Keep in mind that some of the post-hoc tests that you have performed may not account for familywise error. If you perform a lot of tests, you may be getting erroneous significant result (way higher than the goal of 5% type I error). E.g. if G1-G3 (or the logs of these) is significant with a p-value of .04, in reality to be significant at the 5% level, you really need to have a p-value less than .05/3 = .01667, based on a Bonferroni correction for three tests. Thus in fact you may actually have three non-significant results. Again, there are many choices for how to deal with familywise error, but you should try multiple approach and then select the result that you like best.
2. As explained above, the post-hoc tests may not actually contradict the omnibus tests once you have taken familywise error into account. If you have gone through the trouble of using bootstrapping, I would tend to trust those results since fewer assumptions are being made. You also get the pairwise comparisons directly.
Charles
As far as I can see Real Statistics for 2 independent samples calculates Hedges g instead of Cohen d. Cohen d formula (Cohen, 1988, p.67) does not include (n-1) correction.
The formula of d converted from r is the second proof. d=r/sqrt(r^2+4).
Best regards
Sorry, the correct formula for d from r is here: d=2*r/sqrt(1-r^2)
And d from t: 2*t/sqrt(df)
All of them give the same result
Sergey,
I have tried to use the terminology found in
HEDGES, L. & OLKIN, I. (1985). Statistical Methods for Meta-Analysis. Academic Press, New York, NY.
and in
Enzmann, D. (2015) Notes on Effect Size Measures for the Difference of Means from Two Independent Groups: The Case of Cohen’s d and Hedges’ g.
https://www.researchgate.net/publication/270703432_Notes_on_Effect_Size_Measures_for_the_Difference_of_Means_From_Two_Independent_Groups_The_Case_of_Cohen's_d_and_Hedges'_g
Hi Charles,
I’m trying to evaluate the effectiveness of an intervention. I have two groups that were not randomly assigned, group A (10 participants) and Group B (12 participants). Group A and B took a pretest, Group A participated in the intervention, while Group B did not. I then provided a post test to both Group A and Group B. What statistical analysis should I use to evaluate the impact of the intervention?
I am not sure if you were able to come up with a solution for this. A recent problem I was working had similar issues. We had used a linear regression with the first part being difference in differences, second part having all the observable variables and third part being a Heckman two stage model for un-observable variables. It’s worth looking into this.
Hi Charles,
I’m doing a project and i need your help. I have 2 groups both these groups include 15 15 variables and the mean of Group A is 8.4 and mean of Group B is 9.06.
I calculated the variance and Group A has 3.47 variance and Group B had 3.98 variance .I couldn’t figure out which t test i should use?
So my question is Should I use t test for equal variance of population or t test for unequal variance?
Plz reply as soonew as possible
Kashif,
The variances are similar enough that you can use the equal variances version. You will get a similar result if you use the unequal variance test though.
Charles
Sorry if this has been asked, but how do you decided when variance is equal or unequal? I have two variables, each with a mean of .096 and .076 respectively. Each has a variance of .226 and .132 respectively. While thinking of them as integers, they may be considered equal, considering they are such small figures, I am not sure if there is a percentage threshold for decided if variance is unequal or equal. I conducted an F-test but I am not sure how to decide from the output whether or not they are considered equal. The F value is 1.706 which is greater than the F critical one-tail value of 1.106. That is not much difference, but the P(F<=f) one-tail is very tiny. Does any P value < .05 mean that there is unequal variance?
MG,
Assuming that you are using an F test to compare two variances, p < .05 is interpreted as unequal variances. In any case, when in doubt, assume that the variances are unequal. If the variances are reasonably similar then the p-value from the unequal variance t test is more or less equal to that of the equal variance test. Charles
Hi hello.
I am doing a project on diseased and healthy blood smears cells. If the patients are different for both groups, would this study be a 2 sample test?
Also, how will I determine the null hypothesis and alternative hypothesis of my study?
Basically, T test is used to confirm whether these two groups are statistically significant different from each other.
Jimmy,
Yes, this could be viewed as a two independent sample test (assuming the patients were assigned to the two groups randomly).
The null hypothesis could be that the mean of the two groups are the same. The alternative hypothesis is that the means are different.
Charles
How do you find (or read) alpha from the two tail equal variance t test output?
Ben,
You can specify the alpha value in the dialog box for Excel’s data analysis tool, but this value does not appear in the output.
Charles
Hello,
I found this link very informative and replies are very much good. Therefore, i am writing to you.
I have two hypothesis and i want to find p-value so that i could know which hypothesis is true.
H0= Low water quality is unrelated to health of people in marginalized area.
H1= Low water quality and health of people in marginalized area are related.
There are two variables in it.. water quality(independent) and health(dependent)
i have 20 values against each variable.
I want to know following questions from you:
1) is the data paired?
2) Is paired sample t-test suitable for it?
In my opinion, data is paired and paired sample t-test can be applied. I performed this test and found that my alternate hypothesis is true.
I want your opinion and confirm it.
If this test is not true then please guide me . Which test should be applied?
Thank you
Madiha,
1. If the data for each pair is from the same subject, then the data is paired.
2. If the data is paired (as described above), then the paired t test is a suitable test provided the test assumptions are met (esp. that the differences between each of the 20 pairs is reasonably normally distributed).
Charles
Thank you Charles.
What do you mean by same subject? Can you explain? because i m confused about it..
What i understood, here same subject means taking answers of both variables from one respondent.
I collected water quality information and health information from same household….
Am i going on right track?
Madiha
Madiha,
Yes, you are on the right track. In this case the same subject is the respondent. It looks like paired t test is the way to go.
Charles
Dear Charles,
Thanks a lot..
I am really thankful for your guidance…
Madiha
Thanks that is what I thought after reading through that section. Very helpful.
I am doing a study comparing whether people who receive smiles are more likely to smile back than people who do not receive smiles. It is a Science fair project for my dAughter. The data will be yes no responses for eAch group. Wondering what statistical test is best to compare the two groups?
Christopher,
It sounds like a fit for chi-square test of independence. See
Independence Testing
Charles
Hi Charles,
I have two lists of words which I am going to use in my experiment. Each list contains 30 words. I need to make sure that there is no difference between these two lists in terms of word length and syllables.
the data looks like this:
List A no of characters syllables
fog 3 1
banana 6 2
List B
bat 3 1
orange 6 2
The question is what type of test should I use? and does these hypotheses correct:
H0: There is a difference between the two lists.
H1: There is no difference between the two lists.
Many thanks 🙂
the order of the data is a mess. I will retype it here again:
List A
fog , no of syllable 1 , length: 3
banana, no of syll 2 , length 6
List B
bat, no of syll 1 , length :3
etc
Manal,
If you only need to compare the number of syllables (or the word lengths), then you could use a two sample t test (provided the assumptions for the test are met). Since you are comparing both syllables and word length at the same time, you could use Hotelling’s T-square test. This is described on the Real Statistics website.
Charles
Thank you for your reply, but what about the hypothesis?is it correct?
I need to prove that the two list are similar .
H0: There is a difference between the two lists.
H1: There is no difference between the two lists.
Manal,
You could use these hypotheses, but you won’t be able to use the usual tests. Instead, you can use
H0: There is no difference between the two lists.
H1: There is a difference between the two lists.
BTW,why do you need to test whether the lists are similar?
Charles
Hi Charlie,
The two lists are the stimuli that I am going to use in my experiemnt. Participants have to read them aloud and then I am going to compare the reaction times. The two list should be similar so that whatever results I will have should not be due to other factors such as length of the word or syllables. so its like I am controlling other variables to test one.
So the t test is good to use in this case ? Sorry but I am confused a little bit with the hypothesis. which one should I use now.
i want to find p-value and t -value. and fill in that table
plzz help me
Table No : 1 Means of weekly pre- and post interventional BPs in muscular relaxation group
Weeks Blood Pre- Post P
pressure intervention intervention (t-paired test)
Mean SD Mean SD
First Systole 152.29 100.6142239 151.39 99.97782779
Diastole 98.09 62.28903635 97.69 63.62393219
Second Systole 146.17 96.28673039 144.85 95.35334944
Diastole 94.56 59.79294942 93.92 59.34040108
Third Systole 138.19 90.64401828 137.17 89.92276936
Diastole 87.71 54.94926797 86.61 54.17145051
Fourth Systole 130.13 84.94473762 128.82 84.01842774
Diastole 80.08 49.55404323 78.69 48.5711648
Table No : 2 Means of weekly pre- and post interventional BPs in breathing control group
Weeks Blood Pre- Post P
pressure intervention intervention (t-paired test)
Mean SD Mean SD
First Systole 153.16 152.21
Diastole 96.08 95.55
Second Systole 146.35 145.35
Diastole 90.68 90.32
Third Systole 139.68 138.75
Diastole 83.6 82.71
Fourth Systole 132.32 131.14
Diastole 76.41 75.39
Table No : 3 Means of pre- and post interventional BPs in the three groups
Group Blood Pre- Post P
pressure intervention intervention (t-paired test)
Mean SD Mean SD
Muscular Systole 141.69 140.5
relaxation Diastole 90.11 89.22
Breathing Control Systole 142.87 141.86
Diastole 86.69 85.99
Control Systole 150.1 151.4
Diastole 87.6 88.2
Table 4 : Means of the first pre interventional BP with Weekly post interventional BPs in the two interventional groups
Group pre interventional p
first week blood 1 st week 2 nd week 3 rd week 4 th week
pressure post interventional post interventional post interventional Post interventional
Muscular Systole
relaxation Diastole
Breathing Control Systole
Diastole
I have provided free tools for doing statistical analysis, but I can’t do the statistical analysis for you. You will need to do that yourself.
Charles
Hi Charles,
I have a whole trial sample of 248 participants. 53 of them have been randomly selected for treatment fidelity assessment. I would like to compare the educational status (e.g. no qualifications, GCSE’s, A-Levels or Degree) between the randomly selected sample (53), and the whole trial sample (248) to see if there are group differences, or if I can generalise the randomly selected sample’s results to the whole trial sample.
Which test would be best for me to use here?
Thanks and best wishes,
Shaira
Shaira,
If you have truly taken a random sample, then with such large groups, based on the central limit theorem you should expect that there is no difference.
In any case, to test a characteristic which has a numeric measurement, you could use a two sample t test. The two samples need to be independent and so one sample would consist of the 53 randomly selected for treatment and the other sample would consist of the remaining 195 participants.
Educational status doesn’t have a numeric a measurement, and so you need to use a different approach — e.g. chi.square test of independence, using the two groups described above and the four categories: no qualifications, GCSE’s, A-Levels or Degree (or some grouping of these categories). The website explains how to do this.
Charles
Thanks Charles!
Absolutely stuck.
I have two sets of data pre and post intervention. The data is 2.4km run times of military recruits from 2016 (pre) and 2017(post). Which is the best t-test to run being as the subjects where completely different but of equal sample size. Each time I run a t test I am creating lots of waffle, is this because I am using mm:ss ?
Example
09:24
08:35
10:11
Help 🙁
Abbi,
If each group is different (and independent), then you would typically use the two independent sample t test.
Sorry, but I don’t understand what you mean by “waffle” here.
Charles
Sorry my English jargon.
Is that the same as a two sample assuming equal variances? Because when I run that test I create numbers that make no sense for example p 8.2348E.
I’m using a Mac and cannot see the two independent sample t test option? Do I need to add it to my data analysis tool?
Thank you
Abbi,
If the recruits are completely different, then you would use a two independent sample t test (whether or not the sample sizes are equal). I still don’t know what you mean by waffle.
Charles
Can someone please clarify for me re: t test
I have a pre & post test but 3 groups
Because it pre & post and I want to know if the end result is a better memory after training I do a paired samples t test (same participants). However, I am not sure
how the 3 groups fit in?
Rose,
With three groups, you should use ANOVA. The extension of the paired t test to more than 2 groups is Repeated Measures ANOVA. See
Repeated Measures ANOVA
Charles
Rose,
This sounds like some sort of two factor Anova, where one factor contains three groups and the other factor is a repeated measures factor (pre and post).
See the following webpage: https://real-statistics.com/anova-repeated-measures/ and more specifically the webpage
https://real-statistics.com/anova-repeated-measures/one-between-subjects-factor-and-one-within-subjects-factor/
Charles
Hi Charles,
A good work but I am confused about how you arrived at:
p-value = TDIST(t, df) = TDIST(2.18, 18) = .043
how did you get the value .043
Hi Wilfred,
There is a typing mistake. It should say
TDIST(t, df, 2) = TDIST(2.18, 18, 2) = .043
Better yet, you should use the newer function, namely
T.DIST.2T(t, df) = T.DIST.2T(2.18, 18) = .043
Thanks for identifying this error. I have now corrected the referenced webpage.
Charles
i have two large samples (280 and 287), pretest / posttest questionnaires (not matched) 55 questions on each. T test has been carried out to check for statistically significant differences between questionnaire 1 and questionnaire 2. All is well however I now have a result for every one of my questions (a lot to report!). I have been looking at it so long i am sure the answer is simple but i just cannot grasp it! My data set has a grouping variable for timepoint 1 and 2, i just want to analyse the whole lot (all responses from A compared to all responses from B) rather than each individual question. Am i missing something?
P.S. I am using SPSS???
Clare,
You can perform the tests and procedures that I suggested using SPSS. They are also available via the Real Statistics Resource Pack in Excel.
Charles
Clare,
It sounds like you have 55 dependent variables, and so you can use MANOVA, or in this case, since you only have two independent variables, you can use Hotelling’s T-square test. It is like a t test when you have multiple dependent variables.
55 dependent variable is quite a large number. It is likely that you would benefit from performing Factor Analysis to reduce this number before performing Hotelling’s T-square test.
Charles
How do I change 4.25126E-07 into an easier number? I understand it is a very small number?
Thank you.
Olivia,
4.25126 x 10^(-7) = .000000425126
Charles
It’s surprising to find on real-statistics.com
a resource so precious about equations.
We will note your page as a benchmark for Two Sample t Test:
equal variances .
We also invite you to link and other web resources for equations like http://equation-solver.org/ or
https://en.wikipedia.org/wiki/Equation.
Thank you ang good luck!
Hi, Charles.
On a bookkeeping assignment I have, I am provided with two groups of words and am asked to find the variances between them. How do I find variances between groups of words?
Jess,
I can tell you what the pooled variance is, but I don’t know what you mean by the variance between two groups.
Charles
Can I use T Test for clinical and visual scale of (1-5) for the ids to find error difference between clinical and visual for more than 150 ids.Please suggest me a method to find difference in error between two scaled data sets…..
Niranjan,
Sorry, but you haven’t provided enough information for me to be able to answer your question.
Charles
let us consider two studies
A1(1,2,3,2,3,1,2) and A2(2,1,3,4,1,5,2) scores of 7 subjects.Can i use T-Test to find error difference between two sets and conclude whether this much percentage difference exists
Niranjan,
You can use the t test to test whether there is a statistically significant difference between the scores.
I don-t really understand what you mean by “conclude whether this much percentage difference exists.”
Charles
I AM MAKING A STUDY ON RELATION SHIP BETWEEN EMOTIONAL MATURITY AND ADJUSTMENT OF HIGHER SECONDARY STUDENTS MY SAMPLE SIZE IS 300 WHAT ARE THE STATISTICAL I NEED TO USE CAN I STOPE ON FINDING r OR GO FOR ttest HOW CAN I DO IT IN EXCEL PLEASE EXPLANE average male 37.82 female37.17 variance 72.23,81.32
Geeba,
Sorry, but your question is not clear to me. In particular, you need to be clearer about what you mean by the relationship between emotional maturity and adjustment. You might be able to use a t test, but you will need the raw data, not just means and variances.
Charles
Hello Charles
I am writing a paper on comparison of four private and 19 state owned companies using ratios.. can u suggest me what test can I apply? I am using Mann Whitney u test, but I need little clarification whether the test is appropriate or not
You haven’t provided enough information for me to answer your question. It is possible that Mann-Whitney is appropriate.
Charles
Hi,
Please could tell me how to work out the power as I understand it is independent from the sample size? Also, I got a p value of 5.65041E-19. How do I change this to an easier number as I know it is a very small number?
Thank you
Olivia,
Sample size is not independent of sample size. See the following webpage:
https://real-statistics.com/students-t-distribution/statistical-power-of-the-t-tests/
5.65041E-19 is scientific notation. It is equivalent to 5.65041 x 10^(E-19), which is equal to 0.0000000000000000000565041, a very small number close to zero.
Charles
Is two sample t-test: equal variances applicable for a random sample of 30 or more data?
Melissa,
Yes, it is applicable for two such random samples.
Charles
Hi
I am have tried to use t test to compare how significantly different each treatment (5 treatment) from control and in one case the t test assumig equal variance gives a significant difference for one treatment while the t test assuming unequal variance gives non significance. However the two variances are actually dissimilar and the number of replicates per treatment is only 3. Can I use t test assuming equal variances for 4 treatments and t test assuming unequal variance to check the significance for the other treatment.
Dinali,
Yes, you can do this, but more importantly by running 5 separate tests you are dramatically increasing the experment-wise error. You might be better off using Dunnett’s test. See the following webpages for more details about these concepts:
Experimentwise error
Unplanned Comparisons
Charles
Best way to compare multiple groups would be to run an ANOVA…Analysis of variance for 3 or more groups. If the P-value<alpha. Then the variance is significant. Also, check the n^2 value to tell if the assessment was weak (.14)
this is fantastic.
I found the answer to Find the Variance of the Difference manually. Can we do the following with the tool?
Before|After |diff manual |Variance of the diff w/ VAR.S
62 78 -16 174.8285714
86 77 9
81 86 -5
71 79 -8
71 94 -23
83 76 7
77 94 -17
63 87 -24
73 70 3
83 94 -11
84 73 11
82 66 16
82 74 8
75 79 -4
75 80 -5
63 88 -25
80 70 10
64 73 -9
66 85 -19
63 74 -11
69 88 -19
73 66 7
79 66 13
59 80 -21
81 88 -7
64 80 -16
77 92 -15
66 88 -22
79 78 1
69 85 -16
89 93 -4
60 76 -16
85 66 19
68 62 6
78 63 15
Jamel,
As I said earlier, to calculate the variance of the difference between the paired data in ranges A1:A50 and B1:B50, you can use the array formula =VAR(A1:A50-B1:B50).
Charles
Hello Charles,
I’m having difficult trying to Find the variance of the difference of the ratings before and after the workshops of paired ratings. I use two paired samples so I perform T-Test Two Paired Samples. The actual answer is 204.81, but when I try running real stat I believe the closest thing to that answer is the STDEV 203.9515663. Is this the correct test to use or do I need to use something else to Find the variance of the differences?
T Test: Two Paired Samples
SUMMARY Alpha 0.05
Groups Count Mean Std Dev Std Err
22 29 72.86206897 47.95289663
223 29 147.7931034 203.9515663
Difference 29 -74.93103448 201.9973357 37.50996357
T TEST
p-value t-crit lower upper
One Tail 0.027778076 1.701130934
Two Tail 0.055556152 2.048407142 -151.7667117 1.904642784
Jamel,
I would have to see the actual data to know what the correct variance is, but to calculate the variance of the difference between the paired data in ranges A1:A100 and B1:B100, you can use the array formula =VAR(A1:A100-B1:B100). Since this is an array formula you need to press Ctrl-Shft-Enter and not just Enter.
Charles
The question: Find the Find the variance of the difference of the ratings of the paired samples:
Data and VAR.P,VAR.S Results
Before After
86 65 89.24408163 VAR.P Answer 204.81
74 74 90.53747412 VAR.S
64 91
80 63
81 79
67 63
75 79
73 69
78 65
73 86
66 94
83 64
87 75
83 67
64 62
61 69
64 87
62 71
79 75
84 81
64 90
72 84
65 84
83 79
78 87
88 73
87 80
88 75
60 63
77 94
73 87
73 84
62 87
63 75
70 64
I’m not sure which test to use in the tool to get 204.81 or if I should just do the manual formula to get it.
Thanks for any suggestions
Hi, I have a specific problem. What t-test im going to use? thank you.
The following Null hypothesis will be tested at 0.05 level of significance.
1. There is no significant difference between the perceptions of the school heads and teachers on the validity of localized word problem activities in grade 10 mathematics.
2. There is no significant difference between the perceptions of the school heads and teachers on the effect of the localized word problem activities on the learning of students.
3. There is no significant difference between the perceptions of the school heads and teachers on the adequacy of localized word problem instructional materials.
4. There is no significant difference between the perceptions of the school heads and
teachers on the problems encountered in localizing word problem learning activities.
Assuming these samples are independent, you need to look at the variances of the samples. If they are relatively similar, you can use the two sample t test with equal variance; otherwise you need to use the version with unequal variances. When in doubt, use the unequal variances version of the test.
Charles
Hi,
which test to used when I have to compare pull, push and factors affecting turnover intent i.e., 3 independent variables on dependent variable. I do not mind if it gives respective correlation. can I use t-test ?
Seles,
It sounds like an analysis that can be performed using One-way ANOVA.
I can’t say for sure since you have only supplied a very limited amount of information.
Charles
Thank you for your reply. I’m doing a project to measure the push, pull, personal factors affecting turnover intention of employees. I select few departments in the organization.
In this, I send out questionnaires of each factor where they rate using Likert scale.
As, I said earlier the dependant variable is turnover intention and the independent variables are push, pull, personal factors.
So, I hope it will help you understand about my concern.
Seles
Seles,
Based on the limited amount of information that I have, I have nothing more to add to what I said previously.
Charles
Hello Mr. Charles,
I want to compare two drugs with 3 batches. I have only one result for each batch. The main purpose is to test equivalence of both the drugs. Which test should be appropriate?
Thank you.
Hiii. Id like to know the difference between two groups for one data…. what do I use? Tysm!! 🙂
Rox,
Sorry, but I don’t understand your question.
Are you trying to determine whether there is a significant difference between the (population) means of two groups? If so, the t test described on the page that you are referencing could be the right choice…if the assumptions for that test are met.
Charles
Hi mr Charles.
I want to compare two component but different brand. Point of check is thickness painting for its component. What should i use statistic tools for that? How many sample should i have. Thank you.
Richy,
It depends on what you want to test. If you want to test whether there is a significant difference between the paint thickness for the two brands, you can use a t test provided the assumptions are met. The sample size required is described on the website. You can also use the Real Statistics data analysis tool to calculate the required sample sizes.
Charles
Hi,
2 groups are tested 3 times each using different tests. Except for the language of presentation, the 2 groups are subject to the same procedure. Group 1 (n=23) used L1 to perform the tests, group 2 (n=28) used L2. How to call this design and what is the appropriate statistical test to compare the two groups’ means?
thank you for your cooperation
Takwa,
It sounds like a mixed ANOVA with one fixed factor (Language) and the other a repeated measures factor (Tests).
Charles
When we are doing t-test assuming equal variences if p-values for one tail and two tail are less than 0.05 but Tstatistic value is not greater than Tcritical value what does that mean
1.can we accept null hypothesis.
2.can we reject null hypothesis.
If p-value < alpha (where alpha is .05), then we reject the null hypothesis. If t stat < t crit, then we reject the null hypothesis. Charles
Isn’t it that when t stat<t crit, then we retain the null hypothesis?
Or should I use a t-test assuming unequal variances, considering that the numbers are so different?
Any help greatly appreciated.
David.
Hello Mr. Zaiontz,
I am currently doing a project looking at the effect of a regulation on a small series of numbers, very small. I have 6 numbers pre-regulation, and 2 after. I need to statistically analyse the change in the numbers, which is quite a large effect in that the numbers for the 2 years after the introduction of the regulation are about half the level of the previous average.
Nevertheless, I need to use statistical analysis.
After some guesswork and basic research, I have chosen the difference between means test, with equal variance. I did it in excel, but because I need to show methodology and have my answers correspond to the equations, I also did it with the equations from example 1 above in the formula tab of excel.
I thought these would be the same as the program in excel except the results are quite different.
I have a few questions.
Would you say that I am doing the correct test?
If so, should I go by the numbers of the excel formula, or the equations above, and if I should trust in the excel function, do you know the equations which excel uses?
Finally, in regards to the test in general, I am taking as the first group the 6 annualized figures before the change, and for the second group the 2 numbers after the change.
Is this wrong? Should I get a mean of the previous numbers and then get a mean of the entire set of 8 numbers and then test for the difference?
It’s due in a few days.
I would greatly appreciate any help you could provide.
Yours sincerely,
Lost and confused.
David,
The formula for the t test presented is the one that Excel uses, and so you should get the same answer.
It is difficult for me to determine whether you are using the correct test based on the information that you have provided. Are you saying that the sample prior to the change consists of 6 randomly chosen elements and the sample after the change consists of a different set of 2 randomly chosen elements?
Charles