Objective
When the assumption of equal population variances is not met for the Two-Sample t-Test with Equal Variances (or when you don’t have enough evidence to know whether it holds) you should consider using a modified version of the t-test. This version is based on the following property.
Key Property
Property 1: Let x̄ and ȳ be the sample means and sx and sy be the sample standard deviations of two samples of size nx and ny respectively. If x and y are normally distributed, or nx and ny are sufficiently large for the Central Limit Theorem to hold, then the random variable
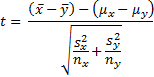
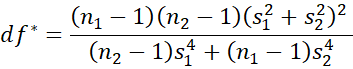
has a t distribution T(df) where the degrees of freedom is expressed as
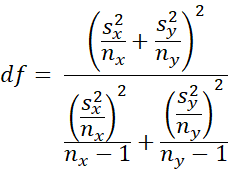
The nearest integer to df is sometimes used.
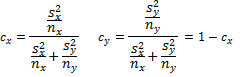
An alternative version (Satterthwaite’s correction) of df (which has the same value) is calculated as follows
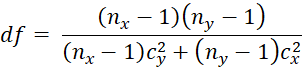
where
Welch’s t-Test
Property 1 can be used to test the difference between sample means even when the population variances are unknown and unequal. The resulting test is called Welch’s t-test. The degrees of freedom for this test will be smaller than (nx – 1) + (ny – 1), the degrees of freedom for the t-test where the variances are equal.
When nx = ny then the value of t in Property 1 is the same as in Property 1 of Two-Sample t-Test with Equal Variances. If, in addition, the variances are equal, then the df values are also the same, which means the p-values of the two tests are the same.
Worksheet Functions
Real Statistics Function: The Real Statistics Resource Pack provides the following function.
DF_POOLED(R1, R2) = degrees of freedom for the two-sample t-test with unequal variances for samples in ranges R1 and R2 (i.e. df in Property 1).
Excel Function: Excel provides the function T.TEST to handle the various two-sample t-tests.
T.TEST(R1, R2, tails, type) = the p-value of the t-test for the difference between the population means based on samples R1 and R2, where tails = 1 (one-tailed) or 2 (two-tailed) and type takes one of the following values:
- the samples have paired values from the same population
- the samples are from populations with the same variance
- the samples are from populations with different variances
These three types correspond to the Excel data analysis tools
- t-Test: Paired Two Sample for Mean
- t-Test: Two-Sample Assuming Equal Variance
- t-Test: Two-Sample Assuming Unequal Variance
Note that when type = 3 the T.TEST function uses the value of the degrees of freedom specified in Property 1 unrounded, while the associated Excel data analysis tool rounds this value down to the nearest integer. On this webpage, we explain how T.TEST is used when type = 2 or 3, while we describe the version where type = 1 in Paired Sample t Test.
The T.TEST function is not available in versions of Excel prior to Excel 2010. For these versions of Excel, the equivalent TTEST function is used instead.
The T.TEST and TTEST functions ignore all empty and non-numeric cells. Both tests assume that α = .05.
Example
Example 1: In Example 1 of Two-Sample t-Test with Equal Variances, we assumed that the population variances were equal since the sample variances were quite similar. We now repeat the analysis assuming that the variances are not necessarily equal.
We use the Excel formula T.TEST(A4:A14,B4:B14,2,3). The first two parameters represent the data for each sample (without labels). The 3rd parameter indicates that we desire a two-tailed test. Finally, the 4th parameter indicates that we are employing a t-test with two independent samples from populations whose variances are not assumed to be equal. Since
T.TEST(A4:A14,B4:B14,2,3) = 0.042642 < .05 = α
we reject the null hypothesis. Note that if we use type = 2, i.e. T.TEST(A4:A14,B4:B14, 2, 2) = 0.040219, the result won’t be very different, which is consistent with the fact that the sample variances are similar (and presumably so are the population variances).
Example 2: Repeat the analysis for Example 1 but with different data for the new flavoring as shown in Figure 1.

Figure 1 – Sample data and box plots for Example 2
Clearly, the sample variances are quite unequal. Using the T.TEST function with type = 3 we get
T.TEST(A4:A13 ,B4:B13, 2, 3) = 0.05773 > .05 = α
and so this time we cannot reject the null hypothesis (for the two-tailed test). Note that if we had used the test with equal variances, namely T.TEST(A4:A13, B4:B13, 2, 2) = 0.048747 < .05 = α, then we would have incorrectly rejected the null hypothesis.
Data Analysis Tools
We can also use Excel’s t-Test: Two-Sample Assuming Unequal Variances data analysis tool for Example 2. From Figure 2, we see that the results are the same.

Figure 2 – Data analysis for the data from Figure 1
Note that the p-value returned by T.TEST is slightly different from that reported by the data analysis tool. This is because the data analysis tool rounds the df to the nearest integer while T.TEST does not.
We can also use a Real Statistics data analysis tool to conduct this test or other versions of the t-test. Click here for details and examples.
Equal Variances Assumption
Generally, even if one variance is up to 3 or 4 times the other, the equal variance assumption will give good results, especially if the sample sizes are equal or almost equal. This rule of thumb is clearly violated in Example 2, and so we need to use the t-test with unequal population variances.
If the variances are equal then the equal and unequal variances versions of the t-test will yield similar results (even when the sample sizes are unequal), although the equal variances version will have slightly better statistical power.
Effect Size
The calculation of the effect size and the effect size confidence interval is the same as for the case where the two samples have equal variances. If the variances are very different, then it might be better to use the variance of one of the samples (e.g. the one representing the Control group) instead of the pooled variance. This version of Cohen’s d effect size is called Glass’ delta.
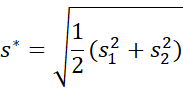
Cohen’s d* and Hedges’ g*
Another approach is to use Cohen’s d* which is defined by
![]()
where
We can now define the less biased Hedges’ version of this effect size, namely
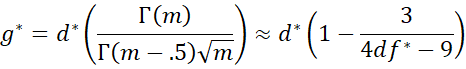
where m = df*/2 and
Example
We can calculate d* and g* for Example 2 using the data in Figure 2 as shown in Figure 3.
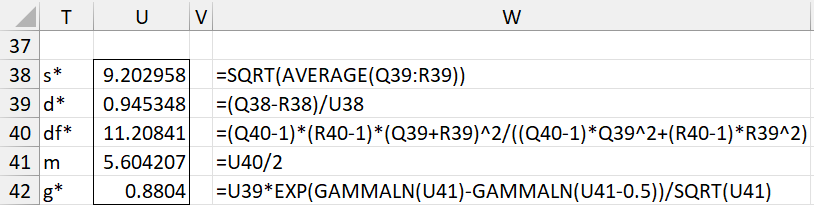
Figure 3 – Cohen’s d* and Hedges’ g*
Interpretation
The default interpretation of Cohen’s d* effect size is
- .20: small effect
- .50: medium effect
- .80: large effect
Confidence Intervals
Click here for a description of how to estimate confidence intervals for Cohen’s d* and Hedges’ g*.
Examples Workbook
Click here to download the Excel workbook with the examples described on this webpage.
References
Howell, D. C. (2010) Statistical methods for psychology (7th ed.). Wadsworth, Cengage Learning.
https://labs.la.utexas.edu/gilden/files/2016/05/Statistics-Text.pdf
Microsoft Support (2022) T.TEST function
https://support.microsoft.com/en-us/office/t-test-function-d4e08ec3-c545-485f-962e-276f7cbed055
Delacre, M., Lakens, D., Ley, C., Liu, L., Leys, C. (2021) Why Hedges’ g*s based on the non-pooled standard deviation should be reported with Welch’s t-test
https://psyarxiv.com/tu6mp/download
In Example 2, how does the df value get calculated as 11?
Hi Jennifer,
The df is calculated as described on this webpage, but the Excel data analysis tool rounds off the df to the nearest integer. The Real Statistics version of this tool does not round off the df. See T-test analysis tool.
Charles
Charles, can you please order the below situations based on the expected power of the statistical test intended to identify the difference between two groups?
1) Datasets come from normal distributions with equal unknown variances
2) Datasets come from normal distributions with unequal known variances
3) Datasets come from two unknown distributions
4) Datasets come from normal distributions with unequal known variances and known unequal means
5) Datasets come from gamma distributions with unknown parameters
After everything I’ve read, I think it should be 1, 4, 2, 5, 3. Thoughts?
Tim,
I don’t quite understand how you compare these 5 dataset pairs. It is not clear to me what effect you are studying in each case: differences in the means? This wouldn’t even make sense for item #4 or for item #3 when the data come from a Cauchy distribution.
Charles
Hi sir
We are conducting a study and we are a little lost since we somehow already forgot about ttest
Our study uses ttest one tailed for unequal variance and we are comparing the binding affinity of 8 different phytochemicals to a positive control.
The values of the phytochems are: -8, -7.4, -5.4, -6.3, -6, -3.4, -5.9, -5.8
The value of the positive control is:
-6
I would like to ask whether how will we reject or accept the hypothesis and if its only normal that we got “NUM!” for: P(T<=t) one-tail, t Critical one-tail, P(T<=t) two-tail, and t Critical two-tail?
Hi Mae,
I see the values for sample 1, but don’t see the second sample. Are you comparing this sample with a hypothetical mean value of -6? If so, you should be using a one-sample t-test and not a two-sample t-test.
Charles
Hi uhmm actually the value of the second sample is the -6 we need to compare those values: -8, -7.4 and so on with that value and we are lost since we pretty much already forgot how to use ttest is there any way you could possibly help us :< btw we are only students so we arent really that good at research itself but if you can help us in any way pls do so thank youu :<
Hi Mae,
Are you saying that the second sample only contains one value, namely -6?
If so, it is not possible to perform a two-sample test since the variance for the second sample is undefined.
This is why I am suggesting that you perform a one-sample t-test where the hypothetical mean is -6.
Charles
Sir! I have the same sample for three tests RESULTS. I have used ANOVA to find out the significant variance between the three test results. then I used a t-test of unequal variance between A-B, A-C, B-C. but I don’t have a null hypothesis. is it okay if I use this kind of analysis and interpret my data, should I use Bonferroni correction or can I retain p=0.05 and interpret my data?
Kumar,
When you say that “I don’t have a null hypothesis”, do you mean that none of the three tests generated a significant result?
If you perform three post-hoc t-tests, you need to use a Bonferroni correction. It is better to use one of the post-hoc tests specifically designed to be used after a significant ANOVA. Tukey’s HSD is usually a good choice. It does not require the use of a Bonferroni correction.
Charles
Hi, I am doing a research study on ply boards. I have three set-ups: Formulation 1, Formulation 2, and Standard. Formulations 1 and 2 are my experimental samples, while the Standard is my control. The test experiments I have to undergo are the water absorption test and strength test. My research questions are as follows:
1. Is there a significant difference in the water absorption test of plyboard made from Jackfruit peels (experimental) and commercial plyboard (control)?
2. Is there a significant difference in the strength test of plyboard made from Jackfruit peels (experimental) and commercial plyboard (control)?
I have used ONE WAY ANOVA to determine if there is a significant difference, and the stats show that it does. Now, I need to do a post hoc test as per my adviser but I do not know how to do it. I hope you can reach out and help me with this matter. Thank you in advance!
Hi Arundel,
There are a number of post-hoc tests after one-way ANOVA. The most common approach is to use Tukey’s HSD. THis topic is covered at
Unplanned ANOVA Post-hoc Tests
Charles
Hi Charles,
Can I use the two-sample t-test assuming unequal variance if my data has a couple of outliers? I have 32 pieces of data and unequal variances. I’m testing time and scores across two conditions so half of my data is discrete and half is continuous so if Welch’s test isn’t appropriate, is there any other statistical tests you could recommend?
Thanks,
-A confused student
Tahlia,
If the normality assumption is met, then you can use the t-test. Of course, since you mentioned that you have some outliers, normality will be a problem (provided the outliers are really outliers). In these situations, you can usually use the Mann-Whitney non-parametric test.
One further caveat needs to be mentioned. You say that you have a combination of discrete and continuous data. It is not clear why you want to perform a t-test (or similar test) on such data in the first place, but even so, this may also cause problems.
Charles
Hi,
I have two independent samples with different means and difference variances. I want to run the t-test on the two means, but specifically I want to compute the probability of a Type II error at different alpha levels. Is it possible to input the means, sample sizes, variances or SDs along with various significance levels somewhere in your software and have it compute for me the Type II probabilities?
Thank you in advance.
Which value that we should use between P1 tail and P2tail ?
Sorry, but I don’t understand your question.
Charles
Hi Charles,
So I performed a T-Test assuming equal variance, as I wasn’t totally sure if the variances were equal, and got significant results. But I noticed the variance in one group was twice as high as the other, so I decided to try the unequal variance t-test, and got the same significant results. But I noticed something strange, in the equal variance test, my observations for each group were 320 and 313, respectively, with a df = 631. Then, in the unequal variance test, my observations changed to 196 and 314, respectively, an my df = 471. What would cause this difference? Does excel remove observations according to some sort of rule in the unequal variance test?
Thank you in advance,
Suzette
Suzette,
I don’t know why the number of observations would change. THis should no happen. It is not surprising that the df changes since this is the main difference between the equal variances and unequal variances version of the t-test.
With such large samples, the equal variances t-test is pretty robust even when the variance of one sample is two or three times the variance of the other sample.
Charles
Hi,
When I tested with unequal variances i got significant results but my t-stat value is 3.5 only (with considerable difference in two samples). Why I am getting results like that.
Thanks in advance,
Ramya,
Are you saying that your test results in a high t-statistic and a low p-value (for a significant result)? This just means that you have evidence that the means of the corresponding populations are likely to be different.
Charles