Probability Density Function
Definition 1: The chi-square distribution with k degrees of freedom, abbreviated χ2(k), has the probability density function (pdf)

k does not have to be an integer and can be any positive real number. f(x) is only defined for x ≥ 0.
The chi-square distribution is equivalent to the gamma distribution where α = k/2 and β = 2.
Chart
Figure 1 displays the graphs of the pdf with degrees of freedom df = 5 and 10. As df grows larger, the fat part of the curve shifts to the right, and the graph of the chi-square distribution becomes more like the graph of a normal distribution.

Figure 1 – Chart of chi-square distributions
Key Properties
Figure 2 provides a summary of the key properties of the chi-square distribution.
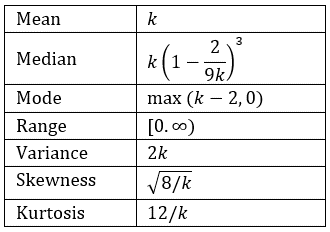
Figure 2 – Key Properties
Other Properties
Click here for more technical details about the chi-square distribution, including proofs of some of the propositions described below. Most of these proofs require some knowledge of calculus.
Property 1: The χ2(k) distribution has mean k and variance 2k
Proof: Click here
Property 2: Suppose the random variable x has a standard normal distribution N(0,1) and let x1, …, xk be k independent sample values of x. Then the random variable 
Proof: Click here
Property 3:
- If x has distribution N(0,1) then x2 has distribution χ2(1)
- Suppose x ~ N(μ,σ2) and z = (x–μ)/σ. Then over repeated samples, z2 has the distribution χ2(1)
- If x1, …, xk are independent observations from a normal population with normal distribution N(μ,σ2) and for each i, zi = (xi–μ)/σ, then the random variable
has a χ2(k) distribution
Proof: These assertions follow directly from Property 2.
Property 4: If x and y are independent random variables and x has distribution χ2(m) and y has distribution χ2(n), then x + y has distribution χ2(m + n)
Proof: Click here
Properties of the Sample Variance
Property 5: If x is drawn from a normally distributed population N(μ,σ2), then for samples of size n, the sample variance s2 has the distribution
![]()
Proof: Click here
Property 6: s2 is an unbiased, consistent estimator of the population variance (as defined in Estimators).
Proof: Click here
Property 7: If x is drawn from a normally distributed population N(μ,σ2), then for samples of size n the random variable s^2}{\sigma^2}")
Proof: This property follows from Property 5.
Property 8: For data from a normal distribution, the mean of the sample variance s2 is σ2, and the variance is

Proof: This can be seen from the proof of Property 6.
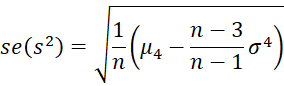
Property 9: For data from any distribution, the mean of the sample variance s2 is σ2 (i.e. the population variance) and the variance of s2 is
![]()
where μ4 is the population kurtosis (see Symmetry, Skewness, and Kurtosis).
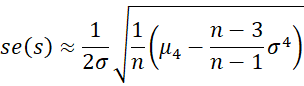
Thus, the standard error of the sample variance s2 is the square root of this value.
For large n, the standard error of the standard deviation is approximately
Excel Worksheet Functions
Excel provides the following functions:
CHISQ.DIST(x, df, cum) = the probability density function value f(x) for the chi-square distribution χ2(df) when cum = FALSE and the corresponding cumulative distribution function F(x) when cum = TRUE.
CHISQ.INV(p, df) = the value x such that CHISQ.DIST(x, df, TRUE) = p, i.e. inverse of CHISQ.DIST(x, df, TRUE)
In addition, Excel provides the following functions:
CHISQ.DIST.RT(x, df) = the right tail at x of the chi-square distribution with df degrees of freedom
CHISQ.INV.RT(p, df) = the value x such that CHISQ.DIST.RT(x, df) = p, i.e. the inverse of CHISQ.DIST.RT(x, df)
Versions of Excel prior to Excel 2010 don’t support these functions. These versions of Excel use CHIDIST, which is equivalent to CHISQ.DIST.RT, and CHIINV, which is equivalent to CHISQ.INV.RT.
Note that
CHISQ.DIST(x, df, TRUE) = 1 – CHISQ.DIST.RT(x, df) = 1 – CHIDIST(x, df)
CHISQ.INV(1-p, df) = CHISQ.INV.RT(p, df) = CHIINV(p, df)
All the above Excel functions support only values of df that are positive integers, and so CHISQ.DIST(x, df, TRUE) = CHISQ.DIST(x, INT(df), TRUE). If you want a more exact value when df is not an integer, you can use the following Real Statistics functions.
Real Statistic Functions
The Real Statistics Resource Pack provides the following worksheet functions.
CHISQ_DIST(x, df, cum) = GAMMA.DIST(x, df/2, 2, cum) = GAMMADIST(x, df/2, 2, cum)
CHISQ_INV(p, df) = GAMMA.INV(p, df/2, 2) = GAMMAINV(p, df/2, 2)
These functions provide better estimates of the chi-square distribution when df is not an integer. The first function is also useful in providing an estimate of the pdf for versions of Excel prior to Excel 2010, where CHISQ.DIST(x, df, FALSE) is not available.
For example
CHISQ.DIST(4, 5.9, TRUE) = CHISQ.DIST(4, 5, TRUE) = .450584, but
CHISQ_DIST(4, 5.9, TRUE) = GAMMA.DIST(4, 5.9/2, 2, TRUE) = .335039
which is a more exact value.
The Real Statistics Resource also provides the following functions:
CHISQ_DIST_RT(x, df) = 1 – CHISQ_DIST(x, df, TRUE)
CHISQ_INV_RT(p, df) = 1 – CHISQ_INV(p, df)
Example
Example 1: Suppose we take samples of size 10 from a population with a normal distribution N(0, 4). Find the mean and variance of the sample distribution of s2.
By Property 8
![]()
![]()
Examples Workbook
Click here to download the Excel workbook with the examples described on this webpage.
Links
↑ Chi-square and F distributions
References
Wikipedia (2012) Chi-square distribution
https://en.wikipedia.org/wiki/Chi-square_distribution
Microsoft Support (2012) CHISQ.DIST function
https://support.microsoft.com/en-us/office/chisq-dist-function-8486b05e-5c05-4942-a9ea-f6b341518732
Stack Exchange (2015) What is the standard error of the sample standard deviation?
https://stats.stackexchange.com/questions/156518/what-is-the-standard-error-of-the-sample-standard-deviation
Tomsky, J. (2008) Standard error of variance
https://groups.google.com/g/sci.stat.math/c/dsgmWBLJoHc
How can I use likart scale and chi square to analyse my data manually.
Emma,
Sorry, but I don’t understand your question. Can you provide a little more background?
Charles
Dear Sir,
I would like to ask how you compute for chi square test for multinomial proportion? Given 6 categories with observed and expected outputs wit 10% significance level from 200 respondents? Appreciate your help. From: Jasmin
Hello Jasmin,
What null hypothesis are you trying to test?
Charles
Greetings Charles:
For the following item (located immediately above the Real Statistic Functions section):
“Note that … CHISQ.INV(p, df) = CHISQ.INV.RT(p, df) = CHIINV(p, df)”,
I suggest the first item be changed to CHISQ.INV(1-p, df). This change uses the probability (area) left of the Chi-square value.
Thank you — and thank for your gracious sharing on Excel!
Hello Tim,
Thank you very much for catching this error. I have now made the correction on the webpage.
I appreciate your help in improving the accuracy of the Real Statistics website. Thanks again for your support.
Charles
good morning charles sir, i would like to ask you to further help for thesis because i was using chi square test. who to sequence a given frequency there are 120 farmer. i was prepared master chart but not solved the accurate so what can i do for manipulating data. how is the procedure of chi square test?. please give me a method with example and also how to prepare master chart? please give a suggestion.
I don’t understand your question, but see my response to your other comment.
Charles
Hi Charles,
I would need to ask you for help.
I am asked to find the value of chi square with 2k degrees of freedom at 0.05 probability level out of my data. The data is a negative binomial distribution from a total of 120 samples, mean=8.725, SS=21853.925 and df=119.
How to calculate the chi squared? your help will be much appreciated.
More power to you,
ronelo
Hello Ronelo,
Sorry, but I don’t understand what test you are using and so I don’t know what chi-square value to use. Perhaps the following webpage will be useful:
https://real-statistics.com/binomial-and-related-distributions/negative-binomial-and-geometric-distributions/
Charles
Dear Charles
Thanks for this excellent website which I have found very useful.
I think there is a typo for the Median in the second ‘observation’.
Differentiating the pdf using the product rule and equating to zero gives a turning point at x = DF – 2 by my calculations.
My result appears consistent with the curves for the pdf which immediately follow
ie DF=5, mode =3 and DF=10, mode =8
Mark,
Yes, there is a typo: the median should have been written as df – 2/3 for large df. But, in any case, I see that Wikipedia shows that the median is approximately k(1-2/(9k))^3 where k = df. For large k, this is indeed approximately k – 2.
Thanks for pointing out this error. I will make the correction on the website.
Charles
Hello Charles,
I think there is a small typo in Theorem 1, the sum should be from i=1 to i=k I believe, not i=n.
Many thanks,\
Fred
Fred,
Thanks for catching this typo. I have just make the correction. I appreciate your help in improving the website.
Charles
Hello Charles, I would like to ask you for a help. I measured p-bodies in different cell lines and different times. I have groups for 0, 1, 2, 3 and more p-bodies. I have two replicates for each cell lines. May I use the chi-square test to compare, if there is any differece? And how handle the replicates, it is possible sum p-bodies for each replicate?
thanks for you response.
Vendula,
You haven’t provided enough information for me to give you a definitive answer, but it doesn’t sound like a fit for chi-square test of independence.
Charles
Hi Charles,
When I run a Chi-Sq Test in real statistics I get the following output:
Chi Sq p-value X-Critical Sig Cramer V
Pearson’s – 623.097 2.9E-122 26.296 Yes 0.345099
Since X-Critical is less than Chi-Sq it gives the result that the variables are associated. In this case the p value is > 0.05 so i assumed its not significant. Do we not consider p-value ?
Kind regards
Shri
Shri,
chisq-crit < chisq is equivalent to p-value < alpha. If the result is significant using the first inequality it will be significant using the second inequality and vice versa. Charles
Four dice were thrown 112 times and the number of times 1 or 3 or 5 was thrown were as under
Number of dice throwing 1 or 3 or 5 0 1 2 3 4
Frequency 10 25 40 30 7
Find the value of chi-square presuming that all dice were fair
Devi,
See the webpage Independence Testing
Charles
Hi Charles,
This might be a silly question, but I want to be clear on something:
Even though the chi sq distribution is X2(k), k would actually demarcate the x that’s in the PDF, correct?
Hi Jonathan,
No, k in X2(k) is the degrees of freedom.
Charles
Okay, perfect.
Thank you.
how you reproduce this chi square graph? I mean what is the x and y-axis ?
All the examples on the website are contained in Excel spreadsheets that you can download for free. For this example, please go to the webpage https://real-statistics.com/free-download/real-statistics-examples-workbook/ and download the Real Statistics Examples Part 1 file.
Charles
Hi sir,
I have 200 measurements of a random variable for whom i have estimated mean and sigma. Now, i want to estimate the error bars on the standard deviation using chi-square function. I don’t know how to do that. Can you please help me on this.
Thanks
Karan
Karan,
I presume that you want to create a chart which shows error bars related to the standard deviation. The website contains the following two references which should help you do this
1) One Sample Hypothesis Testing of the Variance (using Chi-square)
2) Special Excel Charting Capabilities – towards the end of the webpage with the heading: Chart of standard error of the means
Charles