Basic Concepts
In cases where the Fisher exact test is desirable, but where the exact test is not feasible, you can use an approach based on Monte Carlo simulation. We label this a quasi-exact test. In addition to obtaining an estimated p-value, you can also obtain a standard error and confidence interval.
The basic approach is as follows:
- Calculate the ordinary χ20 statistic for Pearson’s chi-square test on your data
- Randomly generate a large number of contingency tables of the same shape with the same row and column totals and determine the number of such contingency tables whose chi-square statistic, using the ordinary chi-square test, is greater than or equal to χ20
- If you generate n such contingency tables, m of which have χ2 ≥ χ20, then the p-value of the quasi-exact test is m/n
- Using the binomial distribution, the estimated standard error and 1-α confidence interval for this p-value are estimated to be
where, as usual, zcrit =NORM.S.INV(1–α/2).
The resulting p-value is an unbiased estimate of the p-value; the more iterations, the more accurate the result.
Note that instead of using the ordinary Pearson chi-square test for independence, we can use the version of the test based on the maximum likelihood statistic.
Example
Example 1: Apply the above procedure to determine the p-value for the chi-square test of independence for the contingency table in range A3:D6 of Figure 1.
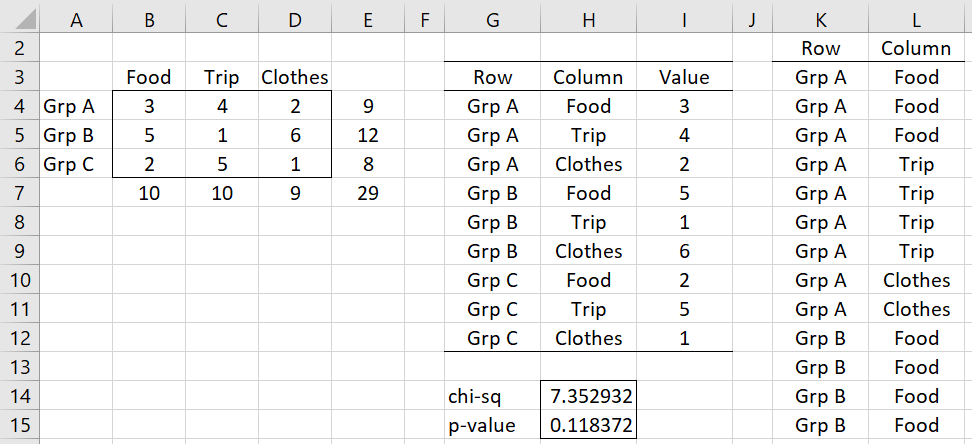
Figure 1 – Reformatting the contingency table
To perform the quasi-exact test, we need to reformat the contingency table in range A3:D6. First, we reformat the contingency into standard (or stacked) format as shown in range G4;I12. This can be done by using the array formula =Anova2Std(A3:D6). We next change to the format shown in range K3:L31 (only the upper part of the range is visible in the figure) by using the array formula FREQ2Raw(G4:I12). Alternatively, these formulas can be combined into the array formula =FREQ2Raw(Anova2Std(A3:D6)).
We note that the chi-square test statistic for the contingency table is 7.352932 (cell H14), as calculated by the formula =CHI_STAT(B4:D6), with an associated p-value of .118372 (cell H15), as calculated by the formula =CHI_TEST(B4:D6) or =CHISQ.DIST.RT(H14, 4).
Random Permutations
The key step in the above procedure is the generation of a random permutation of the contingency table so that the row and column sums remain the same. This can be accomplished by repeatedly shuffling the data in column L, as shown in Figure 2.
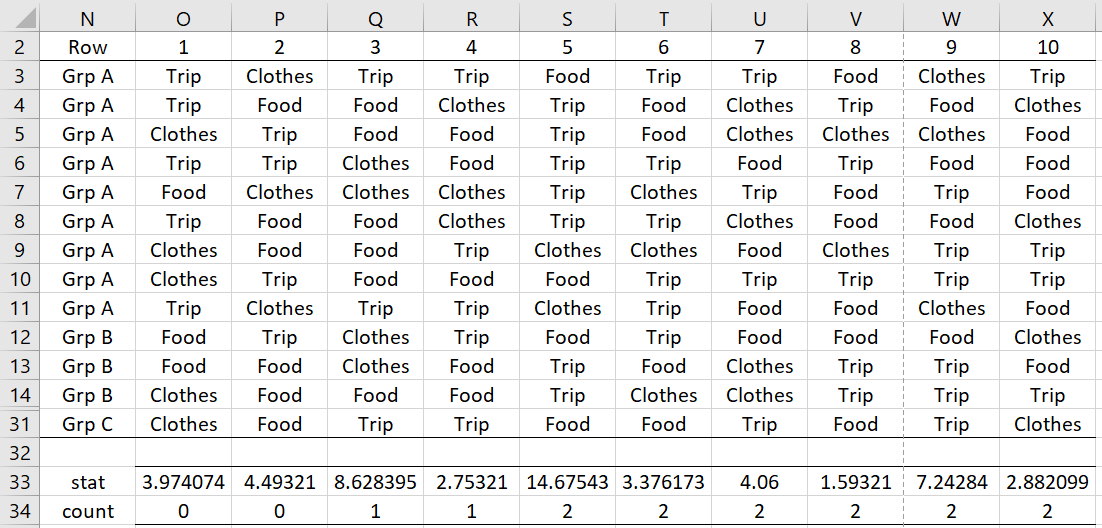
Figure 2 – Random permutations
It is sufficient to keep column K fixed (repeated in column N of Figure 2) and only shuffle column L (as shown in columns O through X). Here, range O3:O31 contains the array formula =SHUFFLES(L3:L31) with the same formula repeated in columns P through X. Figure 2 is based on a simulation of size 10. Usually, we use a much larger simulation, typically with 10,000 iterations.
Of the 10 simulations, only those in columns Q and W have a chi-square statistic ≥ 7.352932 (see cells Q33 and W33). Thus, this simulation p-value is 2/10 = .20, with a standard error of .1265, i.e. the square root of .20(1-20)/10. The calculated 99% confidence interval is (-.126, .526), although since a p-value can’t be negative, this can be viewed as (0, .526). That the precision of this estimate is so wide is not surprising since the number of iterations in the simulation is so small.
Note that for each random permutation shown in Figure 2, a contingency table can be constructed and the chi-square statistic calculated. E.g. for the third iteration of the simulation, we create a contingency table based on columns N and Q and then calculate the chi-square statistic to be 8.628395 (cell Q33). This calculation can also be done via the formula CHISQ_STAT(N3:N31, Q3:Q31).
Worksheet Functions
Real Statistics Functions: The following array functions are provided in the Real Statistics Resource Pack.
CHISQ_STAT(R1, R2, chi) = the chi-square statistic of the contingency table formatted as two-column arrays R1 and R2.
CHISQ_TEST(R1, R2, chi) = p-value of the chi-square test for the contingency table formatted as two-column arrays R1 and R2.
If chi = TRUE (default), then the Pearson chi-square test is used. If chi = FALSE, then the maximum likelihood chi-square test is used.
The whole process of creating the simulation can also be accomplished via the following array function:
CHISQ_SIM (R1, lab, iter, chi, alpha): returns a column array with the values p-value, standard error, and lower/upper ends of a 1–alpha confidence interval (alpha defaults to .01) for a simulated quasi-exact chi-square test of independence with iter iterations (default 10,000) based on a contingency table (with headings) in R1. If chi = TRUE (default), the ordinary chi-square test is used, while if chi = FALSE, the maximum likelihood version of the test is used. If lab = TRUE (default FALSE), a column of labels is appended to the output
In Figure 3, we show a simulation with 10,000 iterations. Here, range G16:H21 contains the array formula
=CHISQ_SIM(A4:D7,TRUE,H16,TRUE,H17)
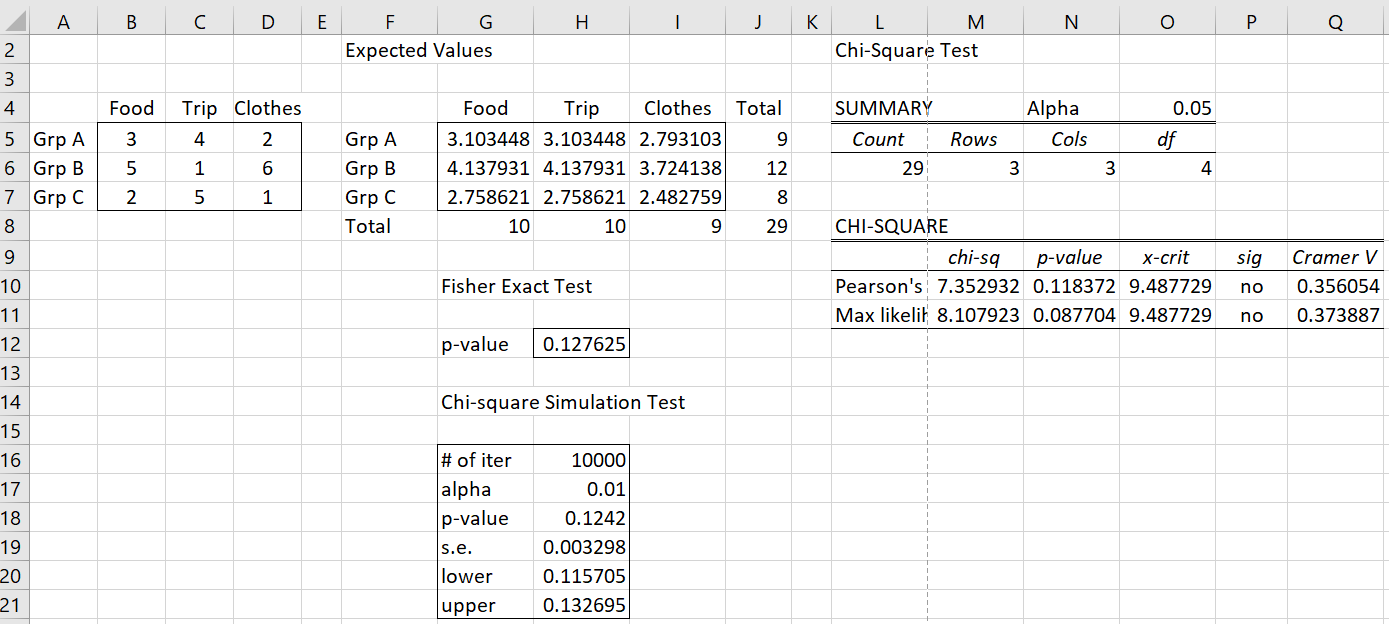
Figure 3 – Simulation with 10,000 iterations
With 10,000 iterations, we get a much more realistic estimate of the p-value, namely .1242. This is not much different from the Fisher exact test result of .127625. The 99% confidence interval of (.116, .133) is reasonably narrow, which gives us more confidence in the simulation estimate.
Data Analysis Tool
Real Statistics Data Analysis Tool: You can obtain the output shown in Figure 3 by pressing Ctrl-m and selecting the Chi-square Test for Independence option from the Misc tab. You next select the Chi-sq option for the Simulation Test with # of Iterations field set to 10000 on the dialog box that appears. See Figure 3 of Independence Testing.
Examples Workbook
Click here to download the Excel workbook with the examples described on this webpage.
Links
↑ Chi-square and F distributions
Reference
Mehta, C. R. and Patel, N. R. (1989) IBM SPSS Exact Tests
https://www.ibm.com/docs/SSLVMB_27.0.0/pdf/en/IBM_SPSS_Exact_Tests.pdf
Prof. Zaints, this example workbook shows the error: “can’t update some of the links in your workbook”. In both worksheets, all outputs display #NAME? error.
Jim,
Do you have the Real Statistics software installed?
What do you see when you enter the formula =VER() in any cell of a new spreadsheet?
Charles