Commonly, Cohen’s d is used as a measure of effect size. We now explore the correlation coefficient r (as well as r2) which provides another common measure of effect size. On this webpage, we also show how to calculate the power of a one-sample correlation test using the approach from Power of a Sample.
Example
Example 1: A market research team is conducting a study in which they believe the correlation between increases in product sales and marketing expenditures is 0.35. What is the power of a one-tailed test if they use a sample of size 40 with α = .05? How big does their sample need to be to carry out the study with α = .05 and power = .80?
The power of the test can be calculated as in Figure 1.
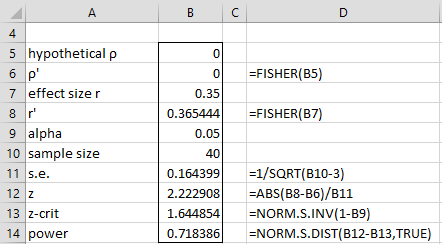
Figure 1 – Determining power of a correlation test
The sample size required to achieve power of 80% and an effect size of .35 is shown in Figure 2.
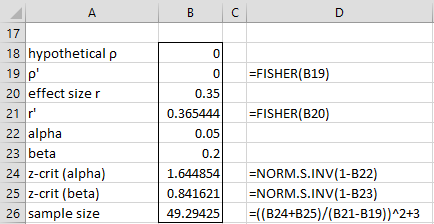
Figure 2 – Determining sample size required for a correlation test
Worksheet Functions
Real Statistics Functions: The Real Statistics Resource Pack supplies the following functions:
CORREL1_POWER(r0, r1, n, tails, α) = the power of a one sample correlation test using the Fisher transformation when r0 = the population correlation (based on the null-hypothesis), r1 = the effect size (observed correlation), n = the sample size, tails = # of tails: 1 or 2 (default) and significance level α (default .05).
CORREL1_SIZE(r0, r1, 1−β,tails, α) = the sample size required to detect an effect of size of r1 (observed correlation) with power 1−β (default .80) when the population correlation (based on the null-hypothesis) is r0, tails = # of tails: 1 or 2 (default) and significance level α (default .05).
Using these Real Statistics functions, we can calculate the results of Example 1 for both the one-tail and two-tail tests as follows:
CORREL1_POWER(0, .35, 40, 1) = 71.8%
CORREL1_SIZE(0, .35, .80, 1) = 49.3
CORREL1_POWER(0, .35, 40, 2) = 60.4%
CORREL1_SIZE(0, .35, .80, 2) = 61.8
Examples Workbook
Click here to download the Excel workbook with the examples described on this webpage.
References
UCLA Statistical Consulting Group (2024) G*Power data analysis examples: power analysis for correlations
https://stats.oarc.ucla.edu/other/gpower/gpower-data-analysis-examples-power-analysis-for-correlations/
Zar, J. H. (2010) Biostatistical analysis 5th Ed. Pearson
STATA (2025) Power analysis for a one sample correlation test
https://www.stata.com/manuals/pss-2poweronecorrelation.pdf
The Chinese University of Hong Kong (2025) Sample size estimation – correlation
https://www2.ccrb.cuhk.edu.hk/stat/other/correlation.htm
Thank you very much. Great contribution.