Basic Concepts
Let’s assume that we have a regression line
![]()
where the regression coefficients bj are based on the n × (k+1) data array X (with ones in the first column).
For any specific values of the xj, say x01, x02, …, x0k, we have the predicted value
![]()
If X0 is the column array with values 1, x01, x02, …, x0k, then an unbiased estimate of the standard error of ŷ0, called the standard error of the fit, is given by the formula
![]()
The 1 – α confidence interval for the true value of ŷ0 is therefore
![]()
Here tcrit is the critical value of the t distribution with dfRes = n − k − 1 degrees of freedom with significance level α/2, i.e. tcrit = T.INV.2T(α, dfRes).
The prediction interval is calculated in a similar way, except that now the variance is the variance of the residual y − ŷ, which is
![]()
The 1 – α prediction interval of ŷ0 is therefore
![]()
Here, the square root term is called the standard error of the prediction.
Observation: Click here for proofs of the above formulas.
Example
Example 1: Find the 95% confidence and prediction intervals for Poverty where Infant Mortality is 7.0, White = 80, and Crime = 400 based on the data in Example 2 of Multiple Regression Analysis using Excel, which is reproduced in Figure 1 (in two blocks to fit better on the page).
 |
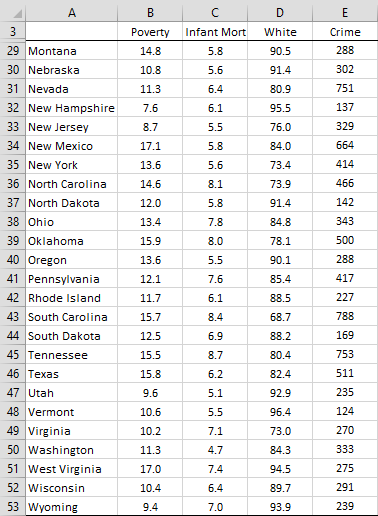 |
Figure 1 – US State Data
We next perform a regression analysis using columns C, D, and E as the independent variables and column B as the dependent variable. Alternatively, we can use Excel’s Regression data analysis tool or, as we have done on the left side of Figure 2, by using the Real Statistics Linear Regression data analysis tool.
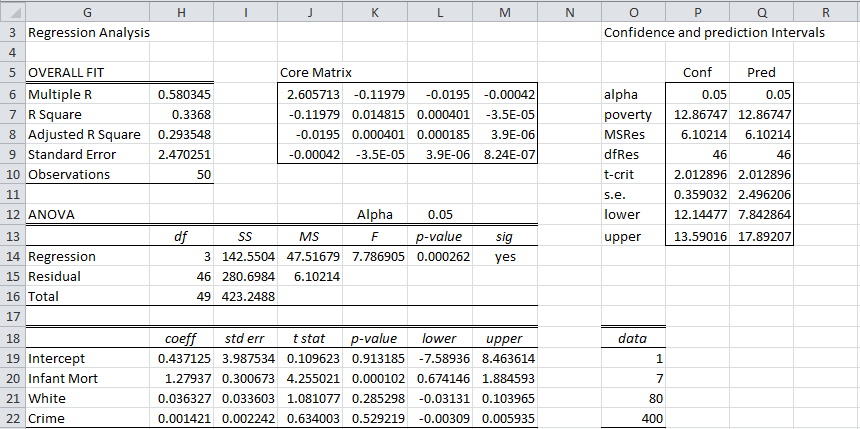
Figure 2 – Calculation of Confidence and Prediction Intervals
We have added the required data for which we want to calculate the confidence/prediction intervals in range O18:O22. We have also inserted the matrix (XTX)-1 in range J6:M9, which we calculate using the Real Statistics formula =CORE(C4:E52), referencing the data in Figure 1. Now we calculate the confidence and prediction intervals, as shown in range O3:Q13. The formulas used for the confidence interval are shown in column S of Figure 3.
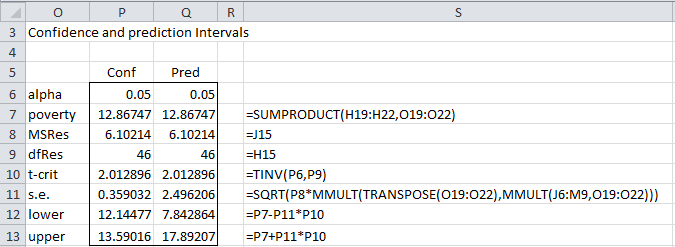
Figure 3 – Key formulas for the confidence interval
The calculations for the prediction interval are identical except that the standard error (cell Q11) is calculated by the formula
=SQRT(P8*(1+MMULT(TRANSPOSE(O19:O22),MMULT(J6:M9,O19:O22))))
Note that this formula and the one in cell P11 are array formulas, and so you need to press Ctrl-Shft-Enter, even though they produce a single value.
The model predicts that 12.867% (cell P7) of the population will be below the poverty level when infant mortality is 7.0 (per 1,000 births), 70% of the population is white and crime is 400 (per 100,000 people). The 95% confidence level for this prediction is (12.14%, 13.59%) and the 95% prediction interval is (7.84%, 17.89%).
Worksheet Functions
Real Statistics Functions: The Real Statistics Resource Pack contains the following array function. Here R0 is a k × 1 array containing X data for which we want to predict a y value, R1 is an n × k array containing the X sample data and R2 is an n × 1 array containing the Y sample data.
RegPred(R0, R1, R2, lab, alpha) = 7 × 1 column range containing the predicted y value for the data in R0, the standard error for the confidence interval, the lower and upper ends of the 1 – alpha confidence interval, the standard error for the prediction interval, the lower and upper ends of the 1 – alpha prediction interval. If lab = TRUE (default is FALSE) then a column of labels is appended to the output.
There is also the following function where the regression coefficients are known. This version will also handle regression without an intercept (simply by not including an intercept coefficient).
RegPredCC(R0, Rc) = predicted y values for x values in range R0 based on the regression coefficients in the column range Rc. Here R0 is an m × k array containing m X data vectors for which we want to predict a y value and Rc is an k × 1 (w/o intercept) or k+1 × 1 (with intercept) range containing the regression coefficients.
There is also the following non-array function:
RegPredC(R0, Rc) = predicted y values for x values in range R0 based on the regression coefficients in range Rc. R0 and Rc can either be a column or row range.
Examples Workbook
Click here to download the Excel workbook with the examples described on this webpage.
Reference
Howell, D. C. (2010) Statistical methods for psychology (7th ed.). Wadsworth, Cengage Learning.
https://labs.la.utexas.edu/gilden/files/2016/05/Statistics-Text.pdf
Wow, great work Dr. Zaiontz! Very intelligent work explained so well. Thank you very much!
Glad I could help.
Charles
Hi
Really sounds confusing. So we 95% confident that the prediction falls between 12.14 and 13.59 but the prediction interval could be way below that and we 95% confident of that.
“The 95% confidence level for this prediction is (12.14%, 13.59%) and the 95% prediction interval is (7.84%, 17.89%)”
kind regards
Declan
Declan,
1. The prediction interval is wider than the confidence interval since it needs to take into account the variability of the prediction of the single point. I use the word “wider” since it is higher at the right end of the interval and lower than the left end of the interval
2. Why are are you adding the percentage symbol to the intervals? Unless your data consists of percentages, you should use (12.14, 13.59) and (7.84, 17.89).
Charles
Where do the values from O19:O22 come from? I cannot seem to get this out of the Multiple Linear Regression tool in Real Statistics or in the excel function.
Hi Brian,
It is input data. You can use whatever values that you like (except that the intercept must be 1).
Charles
Help, the CORE function, which is supposed to output an array (k+1 x k+1), only outputs one value, which is the first value shown in the supposed array. How do I do this correctly?
Bien,
This is an array function and so to get all the values see
Array Formulas and FunctionsArray Formulas and Functions
Charles
I understand inside your package you programed the calculation of inverse of X’X. If I have 14 variables the inverse of X’X will be a matrix of 15 by 15, right? Is it possible I program inverse of X’X, using basic Excel or other basic spreadsheet?
Thank you!
Hello Mark,
Yes, the inverse of X’X is a 15 x 15 matrix
The Real Statistics COR(R1) function can be used to calculate the inverse of X’X where R1 contains X without the extra column of ones.
See https://real-statistics.com/multiple-regression/multiple-regression-analysis/real-statistics-capabilities-for-multiple-regression/
Charles
Slight typo: Where you state: “The 1 – α prediction interval of ŷ0 is therefore … [equation]…Here the last term is called the standard error of the prediction.” The last term in the referenced equation includes the t-crit value. Shouldn’t the standard error be the square-root part of the term without the t-crit? In other words, the last term is t-crit times the s.e.
Hi David,
Yes, that is what I meant by the last term. In any case, I can see how this would cause some confusion. I have now changed the wording. Please let me know whether this is now clear enough. Also, thanks for bringing this issue to my attention.
Charles
Charles,
There is a typo in Figure 3 for the T critical value formula. It should be said =T.INV.2T instead of TINV to be a two-sided value.
Thanks,
-Sun
Hello Sun,
TINV yields the two-tailed critical value and is equivalent to T.INV.2T. It is the older version of the function and is the only one available for Excel 2007 users.
Charles
how did you get the CORE MATRIX????
Is there a link to this spreadsheet with the formulas for the core, please share!
Hi Jill,
The CORE array function is defined at
https://real-statistics.com/multiple-regression/multiple-regression-analysis/real-statistics-capabilities-for-multiple-regression/
You can get the definitions of all the Real Statistics functions on the Tools menu of the Real Statistics website.
Charles
you have to calculate those or are they available in the excel summary results? https://www.youtube.com/watch?v=_ZgWScL3F-A. While I like your layout better this calc made finding the confidence interval much easier. Thanks for your site. I think I might survive to the end of the semester. df = degrees of freedom! SS all this stat jargon!
Hello Jill,
This webpage describes how to calculate the confidence and prediction intervals no matter the number of independent variables. If you only have one independent variable you can use the approach described at
https://real-statistics.com/regression/confidence-and-prediction-intervals/
In any case, you can use the Real Statistics function RegPred to calculate these values for you.
Charles
Hello,
When I attempt to use the RegPred function, the only value that is returned/displayed is the linear regression prediction. The other parts of the output, such as confidence interval and prediction interval, are not displayed. Do you have any suggestions?
Many thanks,
Nick
Hello Nick,
This function is an array function and so you can’t simply press the Enter key to get all the values. The approach to use is pretty simple and is described at
Array Formulas and Functions
Charles
Buen día Charles, muy util todas sus presentaciones de Estadística en Excel. En este ejemplo de la construcción de los intervalos de confianza para la predicción nos habla de información para 50 estados y en efecto en la salida de Excel 50 es la cantidad de observaciones, pero la información original presentada contiene 49 estados. ¿Podré contar con la información faltante para resolver el ejercicio y que mis resultados coinsidan con los suyos? Muy agradecida, soy profesora de Estasdística II en la Universidad CAECE (Centro de Altos Estudios en Ciencias Exactas) en Buenos Aires, Argentina y enfáticamente recomiendo sus publicaciones a mis alumnos.
Hello Susana,
The sample has all 50 states. Wyoming was inadvertently left off the list on the webpage. I have now corrected this and shown Wyoming as well.
Charles
Hi Charles, I am struggling to figure out where X0 comes from. In my example, we are given some matrices and asked to find some of the statistics from them and then give the confidence interval. The given matrices are (X’X), (X’X)-1, (X’y), y’y, and b’. Every other example given to us has come from a textbook word problem or given data. Thank you for your help.
Hi Carolyn,
X0 is a column of data. It can be any data that you want to analyse.
Charles
Hello Mr Zaiontz,
In the first sentence of the third paragraph of this page, you wrote “Here X is the (k+1) × 1 column vector”. However, in a textbook called 《Introduction to Linear Regression Analysis》 by Douglas C.Montgomery, it is indicated that X is the same old (n) × (k+1) matrix which you have shown in “Multiple Regression using Matrices” as the “design matrix”.
I am confused by the two seemingly contradictory statements. I wonder if it is convenient for you to teach me about which one is true?
Thank you
Hi Charles,
Thanks for this post! Could you please help me with my query below:
I have developed a predictive model based on a dataset that contains 100 samples. The response variable of the model (Y_orig) is dependent on three input parameters, X1, X2 and X3. When I use the regression model to predict the response variable (Y_pred) for an X1,X2,X3 combination from within the sample dataset, I get a response Y_pred that is, say 30% different to the Y_orig. I do this for all the samples within the dataset. Some samples get predicted more accurately than the others. So, I can find out the residue (Y_pred-Y_orig) for all the samples in the dataset. How do I obtain a prediction interval for the model with 95% confidence.. i.e., an interval that conveys to the reader that if I forecast a value of Y_pred for a different combination of X1,X2,X3 that is not within the sample dataset, what is the interval within which this model can predict the Y_pred value. Or, should I use a confidence interval based on the Mean and S.D of the sample to define this? Please advise ASAP. Thanks!
You can calculate the prediction interval even for a combination of x1,x2,x3 not in the sample data set. You use the approach described on this webpage.
E.g. the x value = (7, 80, 400) in Example 1 is not part of the sample, yet the 95% prediction interval is calculated.
Charles
Hi Charles
my only problem is the CORE function how can i make this table with the basic excel functions, i am doing this for academic purpose, i fear i might get in trouble by using a different package
thanks in advanced
Festus,
Sorry, but I don’t understand your question. Which table are you referring to? What is your issue with the CORE function?
Charles
It’s a wonderful example and tool! Some people may have issues in building the Core matrix. The best way to do so is to free download the example excel files and the statistical add-in for Excel. Use the example to build a template for your own question.
Hello again Charles,
What is the relationship between the parameters confidence interval (for b0, b1, b2…) and the confidence intervals for the ys?
Does the uncertainty add up?
Fred
Fred,
There is a relationship, but it is not so direct. The formula for the s.e. for the y’s involves the inverse of X’X. The square roots of the diagonal elements on the inverse of X’X are the standard errors of the coefficients b0, b1, …ù
Charles
Please how should I approach this questions?
A) Discuss the coefficient of gender, group size, household size.
Given the following figures as coefficient (-0.08137, -0.01013 and -0.01033) respectively.
B)the variable group size and gender are significant at 1% and 5% respectively, what policy implications do they portray.
Please I need your help, thank you in advance.
Issah,
A) It really depends on the dependent variable. E.g. if this variable is “expense (in dollars)”, then the coefficient -.010033 for household size, means that for every increase of 1 in household size, the expense decreases by $.01.
B) The term “policy implications” doesn’t seem like a statistical concept, and so I can’t really comment.
Charles
Thank you Mr Charles
Hi,
Does MS Excel or SPSS allows for polynomial (cubic curvilinear) regression with 4-6 independent variables? If yes, kindly tell method.
Faiza,
Excel does support this as explained on the following webpage:
Polynomial Regression
I don’t know what sort of support SPSS provides.
Charles
Thanks. I’d been struggling with the computation of the s.e. term because my go-to statistics reference book (I’m old-school, I admit) punted when it came to how to do the calculation and instead deferred to a MINITAB printout. I was able to use your recommendations and that MINITAB printout to fill in the blanks !
If one were to calculate a confidence and/or prediction interval for each predicted-y (ŷi) calculated from observation (Xi), would it have the same kind of arcing shape that the confidence and prediction intervals that result from doing this type of calculation on a single variable linear regression?
Peter,
Probably so, but I have not tried to do this. It is easy enough to create a chart to show whether this is true or not. I suggest that you try to do this.
Charles
Sorry, I forgot to ask this; I think this is clearly true, but I have been wrong before:
Say we get a regression output :
y= b_0 + a_1x1+a_2x2+…..+a_kbk . (b_0 is the intercept)
Does it follow that the regression coefficient of y with respect to any x_i ; i=1,..,k. is a_i? And, is there a way of recovering the intercept b_i from b_0?
Thanks.
by
Fern,
The regression model takes the form y = b0 + b1*x1 + b2*x2 + … + bk*xk
There is only one intercept, namely b0. There is no bi intercept, just a bi coefficient corresponding to xi.
Charles
Hi, great presentations.
A small question: I am not getting the right prdicted value for infant mortality=7, percent white is 80% and crime rate of 400 per 100,000. I am using the coefficients
1.279, 0.0364, 0.001421 from the output , and I am getting:
Predicted(7,80%, 400)= (1.28)(7)+(0.0364)(80)+(0.001421)(400)=(Approx.) 12.47
Am I doing something wrong?
Fern,
Does my answer to your other question help?
Charles
Hi Charles,
Thank you for the great information. I just saw your blog while I’m trying to understand how to build confidence intervals for simple and multiple variables regressions.
I saw a simple method using the information provided from ANOVA within excel:
80% confidence = Se * t_stat/SQT(n) where:
Se = Standard Error of the regression
t_stat = TINV(0.2, df), df = deg of freedom of the risidual
n = number of observation.
Is that correct or it’s approximation?
The sight I got it from is:
https://www.youtube.com/watch?v=_ZgWScL3F-A
Thank you very much
Bahaa
Hi Bahaa,
Yes, this looks correct, except that you shouldn’t divide by SQRT(n) since s.e. already includes this. In the case where there is only one independent variable, the following webpage describes the correct calculations. These are along the lines that you describe.
https://real-statistics.com/regression/confidence-and-prediction-intervals/
Charles
Charles
Thanks for this article. I have a couple of questions:
For the core function, could you tell if I could replicate this using inbuilt Excel functions please? The link on your page https://real-statistics.com/real-statistics-environment/supplemental-functions/ points to your LS MR page, on which I can’t find a reference to it
Could you say how the method you’ve set out is different when using weighted data please?
Rob,
If you are referring to Example 1 on the referenced webpage, then the link listed was incorrect. The link should be to the following webpage:
Multiple Regression Analysis using Excel
This has now been corrected.
You reference the “core function”. Are you referring to CORE. This is described on the webpage
Real Statistics Capabilities for Multiple Regression
If you are referring to some other function, please let me know which one you are referring to.
Charles
Hi Charles,
How to use use the CORE function? I cannot figure it out.
Thanks,
Haijin
Charles,
Please forget about my question. I figured it out anyway.
Thank you for the great stat package.
Haijin
Charles, this is a very helpful site, thank you for putting all this time into it.
Can you advise on applying this method to time series forecasting where the model is built on multivariate regression as you have here? Acknowledging all the usual caveats about out-of-sample forecasting (model uncertainty, parameter uncertainty over time etc.), I would like to apply the prediction intervals as you give them to a time series iterating, say, three steps into the future.
I imagine the first PI for one step into the future can be calculated very similarly to the in-sample PI you give on this page. I know the values of the independent variables into the future and just plug them into the MV regression equation estimate for n+1 and apply the PI based on the sample of n.
But for the PI for the second step into the future, it should capture some of the uncertainty of the first step, such that predictions intervals expand further into the future (like a fan chart to capture the increasing uncertainty of future predictions). Can you advise on this?
Many thanks, Chris
Chris,
I plan to provide this sort of capability for univariate time series forecasting in the next release of the software. Multivariate capabilities of this type will take some time.
Charles
Charles,
Thanks so much for your work. I am trying to duplicate your work for the confidence and prediction intervals for multiple regression, but the site only shows the data for 49 states – Wyoming is not shown in your posted example. Your calculations indicate 50 observations, but I have only been able to input 49. Is it possible to send/post the Poverty, Infant Mort, White, and Crime data for Wyoming?
Thank you.
You can download the full example from the webpage Real Statistics Examples Workbooks.
Charles
Hi Charles,
I have a model for remaining tread on a car tyre:
Tread = b0 + b1* (Tread when new) + b2*(age years)
Can the confidence or prediction intervals answer these questions:
1. What is the remaining tread on a tyre which gives a 95% chance that it won’t fall below a legal limit in 1 more year?
2. If say N tyres are re-used with a certain remaining tread. What fraction of them will fall below the legal limit in the next year?
Any pointers on how to solve these questions would be great!
Thanks
Philip,
Sorry, but I still haven’t had a chance to think about the question you have raised.
Charles
Wouldn’t the core matrix be a 3×3 one as there are only 3 variables?
Got it, there is a X0. But CORE(C4:E52) doesn’t match in dimension though.
CORE(R1) is (XTX)-1 where X is the matrix in range R1 with a first column of all ones added as the first column. If R1 is m x n then X is m x (n+1) and CORE(R1) is (n+1) x (n+1).
Charles
You need to add a column containing ones (for the constant term)
Charles