Hypothesis Testing
Property 1: If the value of Cronbach’s alpha based on a sample of size n with k items is γ, then for any γ0, the statistic W has the following distribution:
![]()
If we want to test the null hypothesis that (the population value of) Cronbach’s alpha is less than some value γ0, we check whether the p-value of W is less than alpha (i.e. the significance level). In this case, we reject the null hypothesis that Cronbach’s alpha < γ0. If we want to test whether Cronbach’s alpha > γ0, then we use a p-value of 1 – the p-value of W.
Example 1: Test whether the value of Cronbach’s alpha in Example 4 of Cronbach’s Alpha is at least .7.
Figure 1 describes the hypothesis test.
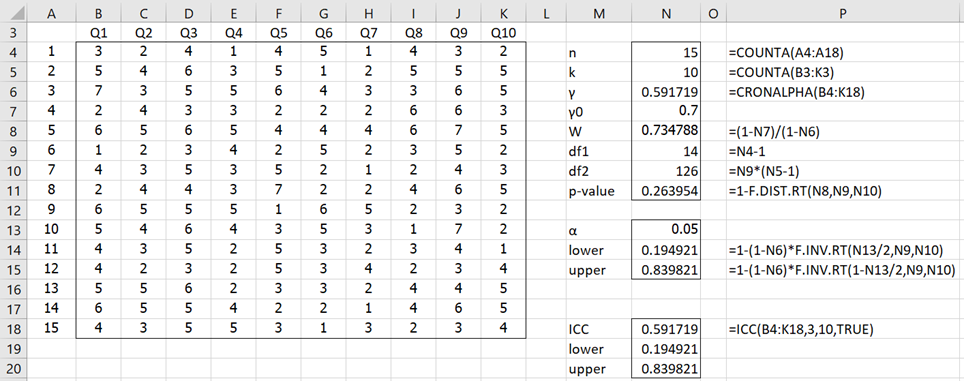
Figure 1 – Hypothesis test for Cronbach’s alpha
We see from Figure 1 that p-value = .26 > .05 = α, and so we cannot refute the null hypothesis that Cronbach’s alpha is at least .7.
Confidence Intervals
Using Property 1, an estimate of the 1–α confidence interval for Cronbach’s alpha based on a sample of size n with k items where Cronbach’s alpha of the sample is γ is given by (γL, γU) where
![]()
![]()
For Example 1, this results in a 95% confidence interval of (.195, 840), as shown in cells N14 and N15. As you can see, the width of the confidence interval = .840 – .195 = .645, which is quite wide.
For a one-tailed test on the left side, the confidence interval is (γL, 1) where γL is as above except that α/2 is replaced by α. For a one-tailed test on the right side, the confidence interval is (-1, γU) where γU is as above except that α/2 is replaced by α.
Worksheet Function
Real Statistics Function: As described in Other ICC Models, the ICC(R1, 2, 1, TRUE, α) array formula (where R1 contains the data) can be used to output a range that contains Cronbach’s alpha and the lower and upper confidence interval values.
Example 2: If you expect Cronbach’s alpha to be .7 for a 10-question test, how big a sample do you need so that your confidence interval is no wider than .05?
Here we are asking the question, “What is the minimum value of n so that γU – γL < .05?” We can find this value using Excel’s Goal Seek capability. This time, however, we will find the value of n by trial and error (with a little bit of intelligence), as shown in Figure 2.
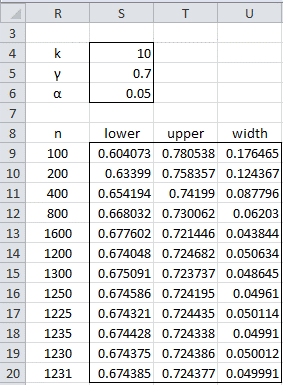
Figure 2 – Sample size to achieve confidence interval width
This approach works since the larger the value of n the smaller the confidence interval width. As we can see from Figure 2, the required sample size is 1,230.
Examples Workbook
Click here to download the Excel workbook with the examples described on this webpage.
Links
References
Hintze, J. L. (2015) Tests for coefficient alpha. NCSS PASS
https://www.ncss.com/wp-content/themes/ncss/pdf/Procedures/PASS/Tests_for_One_Coefficient_Alpha.pdf
Hintze, J. L. (2015) Confidence intervals for coefficient alpha. NCSS PASS
https://www.ncss.com/wp-content/themes/ncss/pdf/Procedures/PASS/Confidence_Intervals_for_Coefficient_Alpha.pdf
Hello Charles
If you want to prove that Cronbach alpha is significantly less than 0.7, what do you do the the equations
P11
P14
P15
I took out the (1-xxxxx) and ended up with a p value of 0.06 which surprised me as I thought a 0.35 Cronbach alpha would be significantly less than 0.7
Also are the CI different for the < argument
thanks
Chris
Hello Chris,
I get a p-value of .09 with a confidence interval of (.195, .840), which is quite a wide range.
Charles
Hello why I am getting W value of 2.12 in testing hypothesis with Cronbach alpa when the statistic W should be between 0 and 1?
Cronbach’s alpha must be less than or equal to 1, but W can be larger than one.
Charles
Hi, I’m having so much difficulty on my research subject can you make a samples of reliability test through cronbach alpha in my research title EFFECTS OF SALES PROMOTION ON PURCHASING DECISION OF CONSUMER with 20 respondents
Hi Angel,
The following webpage shows how to calculate Cronbach’s alpha.
Cronbach’s alpha
The Real Statistics software can be used to simplify the calculations. See
https://www.real-statistics.com/free-download/real-statistics-resource-pack/
Charles
Charles: This is fabulous. Thank you so much for this effort.
I am trying to calculate Cronchbach’s alpha. I am getting value to 0.18 and some negative values (i understand that means order is reversed)
I am not getting p value or CI which you mentioned in above picture. I am computing via internal consistency reliability.
Hello Bhavin Dalal,
Glad that you like Real Statistics.
Yes, the value of Cronbach’s alpha can be low due to reverse coding, although other causes are also possible.
The Real Statistics software doesn’t yet calculate the p-value. You will need to use the formulas in the example.
The confidence interval can actually be calculated via the array formula =ICC(B4:K18,3,10,TRUE). This is explained at the bottom of
https://real-statistics.com/reliability/interrater-reliability/intraclass-correlation/intraclass-correlation-continued/
Charles
Dear Charles
Which formula we can use for calculating cronbach alpha through MS Excel………….. i searched but unable to get ……… Pls help
See Cronbach Alpha
Charles
Dear Charles,
I entered data (γ0, γ1, k, pow, tail, α) = (0.6, 0.65, 80, 0.8, 2, 0.05), the program error is “A tremor time error has occurred. Select the gain. Unable to FINV get the property of the WorksheetFunction class”.
Is the number of items (80) too big? Thanks.
Dear Dung,
No, 80 is not too big. I believe there is a bug in the software.
I see that CALPHA_POWER(.6,.65,878,80,2,.05 = .800052 and CALPHA_POWER(.6,.65,877,80,2,.05) = .799617. Thus the sample size should be n = 878.
This will be resolved in the next release of the software, but for now you can use the CALPHA_POWER function to make successive approximations of the sample size.
Thanks very much for identifying this problem.
Charles