In Skewness and Kurtosis Analysis, we show how to use skewness and kurtosis to determine whether a data set is normally distributed. In particular, we demonstrate the Jarque-Barre test. We now describe a more powerful test that is also based on skewness and kurtosis.
We first describe the Skewness and Kurtosis tests, and then we describe the D’Agostino-Pearson Test, which is an integration of these two tests.
Skewness Test
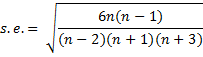
The normal distribution has skewness equal to zero. The skewness test determines whether the skewness of the data is statistically different from zero. The test is based on the fact that when data are normally distributed the test statistic zs = skew/s.e. has a standard normal distribution where skew = the skewness of the sample data and the standard error is given by the following formula where n = the sample size.
Example 1: Conduct the skewness test for the data in range B4:C15 of Figure 1.

Figure 1 – Sample data
The test results are shown in Figure 2.
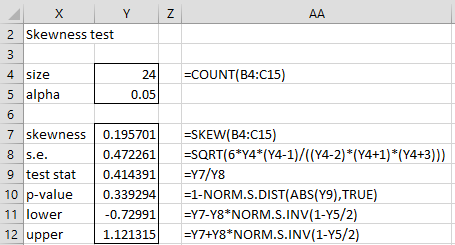
Figure 2 – Skewness Test
We see from Figure 2 that the skewness is not significantly different from zero and in fact, the 95% confidence interval is (-.72991, 1.21315).
Improved Version
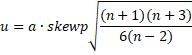
The following is an improved version of the skewness test based on the population version of skewness. As in the previous version, when the data are normally distributed and n > 8, the test statistic zs has an approximately standard normal distribution.
![]() where
where
Kurtosis Test
The normal distribution has kurtosis equal to zero. The kurtosis test determines whether the kurtosis of the data is statistically different from zero. The test is based on the fact that when the data are normally distributed the test statistic zk = kurt/s.e. has a standard normal distribution where kurt = the kurtosis of the sample data and the standard error is given by the following formula where n = the sample size
Example 2: Conduct the kurtosis test for the data in range B4:C15 of Figure 1.
The test results are shown in Figure 3.
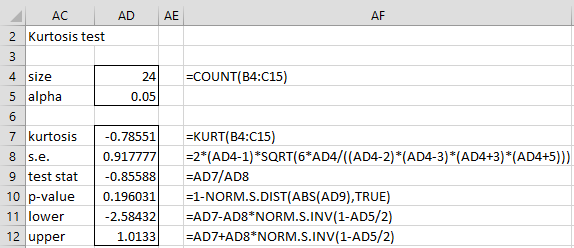
Figure 3 – Kurtosis Test
Improved Version
The following is an improved version of the kurtosis test based on the population version of kurtosis. As in the previous version, when the data are normally distributed and n > 20, the test statistic zk has an approximately standard normal distribution.
![]()
where


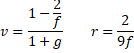
Here kurp is the population version of the kurtosis statistic as defined in Symmetry, Skewness and Kurtosis without 3 subtracted. It is calculated by the Real Statistics formula KURTP(R1, FALSE).
D’Agostino-Pearson Omnibus Test
The D’Agostino-Pearson test is based on the fact that when the data is normally distributed the test statistic 
![]()
This test should generally not be used for data sets with less than 20 elements.
Real Statistics Functions: The Real Statistics Resource Pack contains the following functions.
DAGOSTINO(R1) = the D’Agostino-Pearson test statistic for the data in the range R1
DPTEST(R1) = p-value of the D’Agostino-Pearson test on the data in R1
Example 3: Use the D’Agostino-Pearson Test to determine whether the data in range B4:C15 of Figure 1 is normally distributed.
The test is shown in Figure 4, with reference to cells in Figures 1, 2, and 3. From the figure, we see that p-value = .636273 > .05 = α, and so conclude there are no grounds to reject the null hypothesis that the data are normally distributed, a conclusion which agrees with that obtained using the Shapiro-Wilk test.

Figure 4 – D’Agostino-Pearson Test for Normality
More Worksheet Functions
Real Statistics Functions: The Real Statistics Resource Pack provides the following array functions.
SKEWTEST(R1, lab, alpha) – array function that tests whether the skewness of the sample data in R1 is zero (consistent with a normal distribution). The output consists of a 6 × 1 range containing the sample skewness, standard error, test statistic zs, p-value, and 1–alpha confidence interval limits.
SKEWPTEST(R1, lab, alpha) – array function that tests whether the skewness of the sample data in R1 is zero based on the population test. The output consists of a 3 × 1 range containing the population skewness, test statistic zs, and p-value.
KURTTEST(R1, lab, alpha) – array function which tests whether the kurtosis of the sample data in R1 is zero (consistent with a normal distribution). The output consists of a 6 × 1 range containing the sample kurtosis, standard error, test statistic zk, p-value, and 1–alpha confidence interval limits.
KURTPTEST(R1, lab, alpha) – array function which tests whether the kurtosis of the sample data in R1 is zero based on the population test. The output consists of a 3 × 1 range containing the population kurtosis (without 3 subtracted), test statistic zk, and p-value.
DAGOSTINO(R1, pop) = the D’Agostino-Pearson test statistic
DPTEST(R1, pop) = p-value of the D’Agostino-Pearson test on the data in R1
If lab = TRUE then the output contains a column of labels (default = FALSE). The default for alpha is .05. If pop = TRUE (default), then the population version of the D’Agostino-Pearson test is used (based on the population skewness and kurtosis measures); otherwise, the simpler version is used (based on the sample skewness and kurtosis measures).
Examples
The output in range Q8:R13 of Figure 2 can be obtained using the array formula =SKEWTEST(B4:C15,TRUE). The output in range V8:W13 of Figure 3 can be obtained using the array formula =KURTTEST(B4:C15,TRUE).
The formula =DAGOSTINO(B4:C15,FALSE) can be used to obtain the output in cell AB5 of Figure 4, while =DPTEST(B4:C15,FALSE) can be used to obtain the output in cell AB6 of that figure.
Figure 5 shows the output from the various functions on the data in range B4:C15.
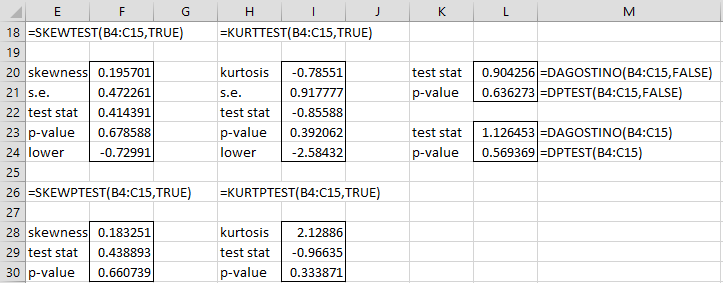
Figure 5 – D’Agostino-Pearson function examples
Data Analysis Tool
Real Statistics Data Analysis Tool: When you choose the Shapiro-Wilk option from the Descriptive Statistics and Normality Test data analysis tool, in addition to the output from the Shapiro-Wilk test for normality, you will also see the output from the D’Agostino-Pearson test (the population version).
Examples Workbook
Click here to download the Excel workbook with the examples described on this webpage.
References
Hintze. J. L. (2007) Descriptive statistics. NCSS User’s Guide II
https://www.ncss.com/wp-content/themes/ncss/pdf/Procedures/NCSS/Descriptive_Statistics.pdf
SPSS (2016) Descriptive algorithms. IBM SPSS Statistics 24 Algorithms
ftp://ftp.software.ibm.com/software/analytics/spss/documentation/statistics/24.0/en/client/Manuals/IBM_SPSS_Statistics_Algorithms.pdf
Winkler, A. M. (2011) Normality tests I: Brief overview
https://brainder.org/2011/07/03/normality-tests-i/
Charles,
I was hoping to find some test that could test significance on two curves (composed of the same points), but one with a non-randomly (polarized) set of points (distances from an object) and one with a randomly-distributed set of points (random distances from the same object). I thought the D’Agostino test might be it (the two curves do differ in skewness and kurtosis), but can’t see how to put a significance (p-value) on the difference between the two curves. I would also like to echo all the positive comments on how helpful your site is!
Anna,
Thanks for your kind remarks.
The D’Agostino-Pearson Test is used to test normality. The test you are looking for seems more like the Anderson-Darling test. See
https://real-statistics.com/non-parametric-tests/goodness-of-fit-tests/two-sample-anderson-darling-test/
Charles
Is this video correct regarding how to do D Agostino Pearson Test in Excel?:https://www.youtube.com/watch?v=r4joU_mPUaw
Hello Nafel,
Yes, it does seem to use the same formulas as shown on the Real Statistics webpage based on the simpler estimates for the standard errors of skewness and kurtosis. Note that the standard error for kurtosis that is given in the video is equivalent to the one described on the Real Statistics webpage (using algebra).
Charles
How to do D Agostino Pearson Test in SPSS?
Hello Fawzeiah,
Sorry, but I don’t use SPSS, and so I don’t know the answer to your question.
Charles
Hello Charles!
Thank you for your hard work, website, and excel plugin. For a curious person like me, it has provided enough mental food for months, if not years.
I think I have found an error – In the formulae for the improved version of the population Kurtosis based test, the kurtosis value is adjusted such that for a normal distribution it is 0 (same as excel and your plugin), but in the formula for variable g, the adjustment done uses a term 3*(n-1)/(n+1), which would lead to an expected value of 3. I think this term should be replaced by 6/(n+1). I have tried this, and the answer I get matched with what I expect to work if I were to manually calculate D’Agostino test statistic and match with what your plugin calculates.
Regards,
Raghunath
Raghunath,
Thank you for identifying the need to clarify this point on the webpage. I have now revised the webpage to clarify which version of the kurtosis statistic is being used. I need to decide whether to change the kurtosis statistic calculated by the KURTP function (currently it is the version that includes the 3). I am reluctant to make changes to the output (since this may require users to change spreadsheets that they created earlier), but logically I should have used the version that subtracts off the 3.
Charles
Good morning Dear Doctor Charles, excuse me for the question I am new to these issues, I am performing the Normality Test on a sample (greater than 7 Data) I am performing it with D’Agóstino Pearson, the data is modal data and he tells me no there is normality in the data, what other test could I perform to find normality in the data?
Thank you.
You can use the Shapiro-Wilk test, but you should avoid shopping around for multiple tests until you find one that gives you the results that you like. Generally, I prefer the Shapiro-Wilk test for normality.
Charles
Hi Charles!
Is it safe to assume that when a data is repeated several times, the D’Agostino Test should be used over the Shapiro-Wilk test?
I understand that the D’Agostino -Pearson Test should not be used for sample of less than 20. Can you suggest an alternative to this test considering that some data are repeated several times in my data set?
Thanks a lot.
Hi Robert,
How big is the data set? If it is small, can you specify the elements in the data set?
Charles
Hi Charles,
My data set are responses to a survey done following the a 7 point likert scale. I surveyed three groups. The two groups I had 20 respondents while the other one is 19. Not sure if this is what you meant.
Robert
Robert,
Yes, it does seem reasonable to use the D’Agostino-Pearson test. I would be cautious since intrinsically Likert data isn’t continuous, but with a 7-point scale, you might be ok. To be sure, I would also look at a box plot and/or QQ plot.
Charles
Hi,
Any concern about validity of this test, specially for n>8 to n<20?
I've read this on Wikipedia:
"Note that the statistics g1, g2 are not independent, only uncorrelated. Therefore, their transforms Z1, Z2 will be dependent also (Shenton & Bowman 1977), rendering the validity of χ2 approximation questionable."
Hello Stefano,
That the χ2 approximation is questionable is a very interesting point. Thank you very much for bringing this to my attention,
I was not able to find Shenton & Bowman 1977. Do you have any reference that goes into this issue in more detail?
Charles
Hi. I want to know the step-by-step procedure in testing for normality using the D’Agostino-Pearson test.. Could you give me some references? Thank you for the response
Hi Charles,
I installed Real Statistics Resource Pack and checked for Xrealstats box in Add-Ins, but when I click Add-ins ribbon buttom and list Real statistics menu, I don’t find the D’Agostino-Pearson test: where is it?
Thanks,
Massimo
Hello Mr. Charles, will you please explain to me what is the formula of D’Agostino-Pearson Omnibus test? I am just a college student, asked to report about this test. Thank you!
Hello James,
The formula is (z_k)^2 + (z_s)^2, which has a chi-square distribution with two degrees of freedom.
Essentially this test is a combination of the skewness test (using the formula for z_s given on the webpage) and the kurtosis test (using the formula for z_k given on the webpage). Each of these tests is based on the z_k and z_s statistics being standard normally distributed. When a statistic z is standard normally distributed, then its square z^2 has a chi-square distribution with one degree of freedom. It also turns out that if two statistics have a chi-square distribution with one degree of freedom, then their sum has a chi-square distribution with two degrees of freedom, which is the motivation for the d’Agostino-Pearson test.
Charles
Thank you so much Mr. Charles! I understand your explanation very well.
Hi Charles,
I have used the Software Q-DAS qs-STAT to carry out the Test for Normaldistribution according to D’Agostino.
My Sample included 50 values, but the test according to D’Agostino could not be developed or run through. What is the condition for this test to be developed or to be applied to my Sample of 50 values? Other test’s were developed or applied succsesfully to my sample but not the test according D’Agostino.
Which role plays the skewness and kurtosis in developing or applying this test to my sample?
Could you help me to find the answer for this?
Hello Andrew,
I am not familiar with Q-DAS or qs-STAT and so I can’t comment on this. The Real Statistics software will carry out a D’Agostino test on a sample of size 50. The test is a combination of the jewness and kurtosis test.
Charles
Hi Charles
thx for the finding my typo.
I think some of your readers may want to know which of the many normality tests to use. The best article I found on this matter is from the Journal of Statistical Computation and Simulation, vol 81, 2011, -issue 12.
asymmetric: Shapiro-Wilk, Anderson-Darling
symmetric & low kurtosis(short tail): D’Agrostino, Shapiro-Wilk
symmetric high kurtosis (long tail) : Shapiro-Wilk, Anderson-Darling
Do you have additional thoughts?
thx prof w e f
Thanks for sending me the reference to this article.
I have used the following rule of thumb: use SW in most cases; use D’Agostino when there are a lot of repeated values. I was looking for something simple to follow.
Do you think I should modify this rule of thumb?
Charles
Hi Charles
I used your data in B4:C15 using the Excel function =SKEW(B4:V15,True). Excel reported a skew of 0.043733. I’m wondering how you got 0.19701?
1 34
2 56
3 39
4 71
5 84
6 92
7 44
8 67
9 98
10 49
11 55
12 73
13 50
14 62
15 75
16 44
17 88
18 53
19 61
20 25
21 36
22 66
23 77
24 85
Am I missing something?
prof w e f
The last data element should be 35 and not 85.
Charles
Excuse me !!..
Why Zk^2+Zs^2~X^2(2) ?.
The test for skewness tests whether Zs is standard normal. Similarly, the test for kurtosis test whether Zk is standard normal. A variable x is standard normal is equivalent to x^2 being chi-square with df = 1. Also, variables x and y are standard normal is equivalent to x^2 + y^2 being chi-square with df = 2.
Charles
Grazie, ciao. Best regards,
Max
Hello again,
I came acorss the same problem. When I used KURTTEST(R, TRUE), it came with “kurtosis”. No relevant statistics were produced with the command.
-Sun
Sun Kim,
KURTTEST is an array function and so you can’t simply press Enter to calculate its value. See the following webpage re how to handle array functions:
Array Formulas and Functions
Charles
Charles,
I used Ctl+Shift+Enter key after KURTTEST. And it still came back with “kurtosis”.
“Cntl+Shift+Enter” is for entering a set of numbers as an array, not for performing the KURTTEST, as I understand it.
Anna,
You need to use Ctrl+Shift+Enter whenever the output consists of more than one cell. This is the case fopr KURTTEST.
If, however, you use one of the latest versions of Excel, especiall Excel 365, then you can use Enter and Excel will figure out the rest.
Charles
Charles,
I would like to report the anomaly I found in producing the skewness test-related statistics.
When I tested =SKEWTEST(B4:C15,TRUE), instead of the statistics in Figure, the result came back with “skewness”. When I tested =SKEWTEST for the same range with other argument, the p-value came as 0.196.
As no one has reported this, I wonder I am the only one having this issue.
-Sun
Sun Kim,
SKEWTEST is an array function and so you can’t simply press Enter to calculate its value. See the following webpage re how to handle array functions:
Array Formulas and Functions
Charles
I have a dataset and the results of skew, kurtosis and D’Agostino-Pearson tests are as follows:
ΣPCDD/F TEQ
Mean 0.374150943
Standard Error 0.0242671
Median 0.335
Mode 0.165
Standard Deviation 0.176667157
Sample Variance 0.031211284
Kurtosis -0.633199712
Skewness 0.651551753
Range 0.625
Minimum 0.135
Maximum 0.76
Sum 19.83
Count 53
——————————–
Skew and Kutesis Test
Alpha 0.05
——————————–
Skew and Kutesis Test
S.E. 0.327
Zs (test stat) 1.990
p-value 0.023
Lower Skew 0.010
Upper Skew 1.293
Skewness range test: Acceptable
——————————–
Kurtesis Test
S.E. 0.644
Zs (test stat) -0.983
p-value 0.163
Lower Kurtesis -1.896
Upper Kurtesis 0.630
Kurtesis range test: Acceptable
——————————–
D’Agostino-Pearson Test
Stat 4.925
p-value 0.085
Null hypothesis (normally distributed) Accepted (Alpha=0.05)
—————————————————————————-
Having the p-value of skew test (0.023) <alpha (0.05) yet the normality test acceptable, can I use my data for a t-test and ANOVA or I have to normalize my data first before I run my t-test?
Thank you for your wonderful website and the information you generously share.
Hadi,
Thanks for your kind words about the website.
When different tests give contradictory results it is a judgement call as to whether you should consider your data to be normally distributed. In general though I rely on the Shapiro-Wilk test for normality (unless there are a lot of ties).
How would you normalize your data if you decided the data wasn’t normally distributed?
Charles
Charles,
Great stuff. I have a question. If the alpha of a data I have is > 0.05 (i.e. the null is not rejected),
is the std deviation of the data set usable to model as the spread of the data ?
For e.g. if the data were actual demand of a product.
I wanted to find say a 98%CI of the range of expected future demand. Could I say that mean + z*std.deviation, is the expected demand level with 98% confidence (where z=norminv(p=.98)) ?
(given that the data can be treated as “normal”)
Jay,
Yes, you can do all of these things. In particular, you can create confidence intervals even when the null hypothesis is not rejected.
Charles
Can the D’Agostino-Pearson Test be used to check a fit to a Rayleigh distribution, if R1 is the CDF of the Rayleigh value of the data in sorted order?
Also, I noticed a slight typo: “From Figure 4, we see that p-value = .63673…” Should be 6.36273 to match the spreadsheet screen grab.
Steve,
I don’t see any reason why the d’Agostino-Pearson test could be used as you have described. If, however, the data in R1 could be expressed as the sqrt(x^2+y^2) then you could test the x and y data as being normally distributed (using d’Agostino-Pearson or Shapiro-Wilk) and check also that x and y have the same variance and are independent. In this case, you would have grounds for saying that data in R1 follows a Rayleigh distribution.
Thanks for catching the typo. I have now corrected the webpage. I really appreciate your help in improving the accuracy of the website.
Charles