The usual method for estimating the slope of a regression line that fits a set of (x, y) data elements is based on a least-squares estimate. This approach is not valid when the data elements don’t fit a straight line; it is also sensitive to outliers.
Sen’s Slope Definition
We now describe an alternative, more robust, nonparametric estimate of the slope, called Sen’s slope, for the set of pairs (i, xi) where xi is a time series. Sen’s slope is defined as
![]() A 1–α confidence interval for Sen’s slope can be calculated as (lower, upper), where
A 1–α confidence interval for Sen’s slope can be calculated as (lower, upper), where
N = C(n, 2) k = se ⋅ zcrit
lower = m(N–k)/2 upper = m(N+k)/2+1
Here, N = the number of pairs of time series elements (xi, xj) where i < j, and se = the standard error for the Mann-Kendall Test. Also, mh = the hth smallest in the set {(xj–xi)/(j–i): i < j} and zcrit = the 1–α/2 critical value for the normal distribution.
Example
Example 1: Determine Sen’s slope for the time series in Example 1 in Mann-Kendall Test.
The time series is shown in range A4:A15 of Figure 1. As for the Mann-Kendall Test, we construct a table whose row and column headings consist of the elements of the time series. This time, the elements in the table are constructed by placing the following formula in cell D4, highlighting the range D4:O15, and pressing Ctrl-D and Ctrl-R.
=IF(ROW(D4)-ROW(D$4)>COLUMN(D4)-COLUMN($D4),($C4-D$3)/((ROW(D4)-ROW(D$4))-(COLUMN(D4)-COLUMN($D4))),””)
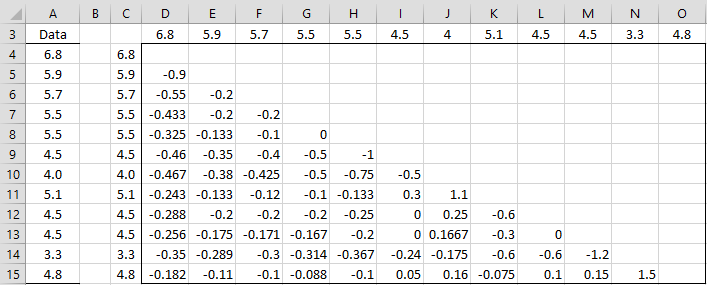
Figure 1 – Sen’s Slope (step 1)
We can now calculate Sen’s slope to be -.2 as shown in cell R11 of Figure 2. This figure also calculates the 95% confidence interval (-3.6667, -0.1) for the slope (as shown in cells R12 and R13).
The value for the standard error in cell R6 is taken from cell R8 of Figure 2 of Mann-Kendall Test.
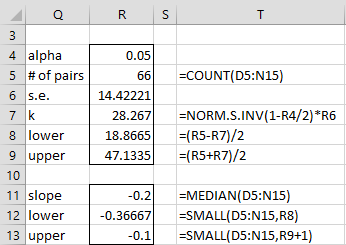
Figure 2 – Sen’s Slope (step 2)
Worksheet Function
Real Statistics Function: The Real Statistics Resource Pack supplies the following array function to automate the steps required to calculate Sen’s slope.
SEN_SLOPE(R1, lab, alpha): returns a column array with the values: Sen’s slope along with the lower and upper limits of the 1–alpha confidence interval.
R1 is a column array containing the time series values. If lab = TRUE, then an extra column of labels is appended to the output (default FALSE), and alpha is the significance level (default .05).
For Example 1, =SEN_SLOPE(A4:A15,TRUE) outputs the results shown in range Q11:R13 of Figure 2.
Data Analysis Tool
Real Statistics Data Analysis Tool: The Real Statistics Resource Pack provides the Trend and Change Point Tests data analysis tool.
To use this data analysis tool for Example 1 (whose data is repeated on the left side of Figure 4), press Ctrl-m and select the Trend and Change Point Tests option from the Time S tab (or from the Time Series dialog box if using the original user interface) and then fill in the dialog box that appears as shown in Figure 3.
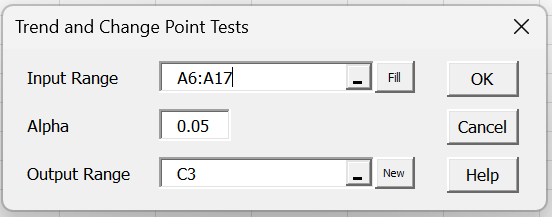
Figure 3 – Trend and Change Point Tests dialog box
Upon pressing the OK button, the output shown in Figure 4 is displayed.
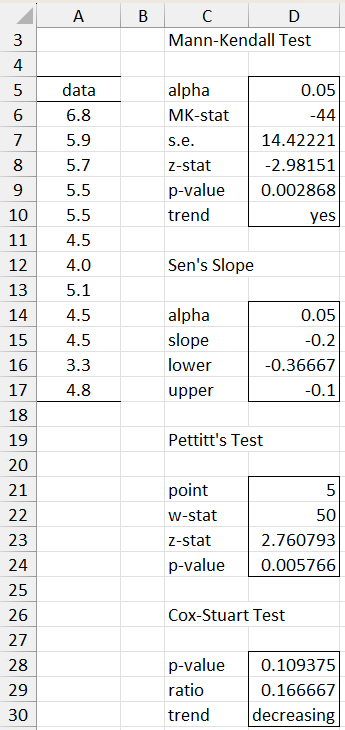
Figure 4 – Data analysis tool output
Examples Workbook
Click here to download the Excel workbook with the examples described on this webpage.
References
Dransfield R.D., Brightwell R. (2012) Sen’s estimator of slope. Avoiding and detecting statistical malpractice: Design & Analysis for Biologists, with R.
http://influentialpoints.com/Training/sens_estimator_of_slope.htm
Gocic, M. and Trajkovic, S. (2012) Analysis of changes in meteorological variables using Mann-Kendall and Sen’s slope estimator statistical tests in Serbia.
https://www.scribd.com/document/775917525/Analysis-of-changes-in-meteorological-variables-using-Mann-Kendall-and-Sen-s-slope-estimator-statistical-tests-in-Serbia
Pacific Northwest National Laboratory (2026) Mann-Kendall test for monotonic trend
https://vsp.pnnl.gov/help/vsample/design_trend_mann_kendall.htm
Thanks for the useful tutorial.
Can Sen’s slope test be applied to time series with seasonality?
Hello Valeria,
1. According to the following reference, Sen’s slope should handle time series data with seasonality.
https://rcompanion.org/handbook/F_13.html#:~:text=The%20Mann%E2%80%93Kendall%20trend%20test,handle%20seasonality%20in%20the%20data
2. There is also a version of the Mann-Kendall test that handles seasonality. See
https://real-statistics.com/time-series-analysis/time-series-miscellaneous/mann-kendall-test/seasonal-kendall-test/
Charles
Hi,
The Mann-Kendall and Sen’s Slope option doesn’t appear in my Time S tab? Any tips on how to get it to appear?
Many thanks,
Natalie
Hello Natalie,
It should be the second to last option on that tab.
What do you see when you insert the formula =VER() in any cell?
Charles
Hi Charles,
Thank you so much for getting back to me.
Second to last option for me is Correlogram and the result when I enter =VER() is 5.11 Excel 2007?
Many thanks,
Natalie
Hi Natalie,
I am afraid that this version of Real Statistics does not support many of the capabilities described on the website since Rel 5.11 was the last release available that supported Excel 2007. The current release that supports later versions of Excel is Rel 8.8. I decided to freeze Excel 2007 support a few years ago since Microsoft stopped supporting this version of Excel.
Charles
Hi Charles,
Thank you, this is very helpful. I would like to plot the Sens slope trendline on the trend graph. What should the y-intercept be? Is it the median of the y values?
Thank you.
Hi Alison,
If you have a time series y1, …, yn, and you calculate Sen’s slope to be m, then the y-intercept = Median {yi-m*i: 1<=i<=n} For Example 1 on this webpage, the y-intercept is then equal to 6.3 (if I haven't made a mistake), resulting in a regression equation of y = -.2x + 6.3. Note that the median of the yi is 5, which is different from 6.3. Thanks for your question. I plan to add the intercept to the webpage. I'll also add a webpage on robust regression using this approach. Charles
Hi Dr, Zaiontz,
I have the same question of Julien. I would like to know if it is possible to do the calculation with missing data in a time-series?
Thanks,
lorena
Lorena,
I believe so. You can remove the missing data and then calculate Sen’s slope. E.g. in Excel, you can use the DELNonNum function to get rid of the non-numeric data.
Charles
Hi Mr Zaiontz,
Thank you for your simple but in depth and helpful tutorial. I wanted to point to you one small error in the phrase : “This figure also calculates the 95% confidence interval (-3.6667, -1) for the slope (as shown in cells R12 and R13).”
It is rather (-0.36667, -0.1).
Hi Pierre-Yves,
Glad to see that you found the tutorial helpful.
Yes, you are correct. The -1 value is in error. I have just corrected this on the webpage.
Thank you very much for spotting this mistake and bringing it to my attention.
Charles
Dear Prof,
The formula doesnot work with me.
=IF(ROW(D4)-ROW(D$4)>COLUMN(D4)-COLUMN($D4),($C4-D$3)/((ROW(D4)-ROW(D$4))-(COLUMN(D4)-COLUMN($D4))),””)
Hello Ahmed,
I believe the formula is correct. Make sure, however, to use the usual quotation marks. If you copy the formula from the webpage, the wrong quotation marks may be copied.
I have added a link to the actual Excel spreadsheet. This will contain all the formulas used.
Charles
Hello Charles,
Is it possible to construct a graph showing MK and Sen’s trend?
Thank you
Hello Wendell,
Of course, you can create a graph of the time-series data, as shown in Figure 3 of
https://www.real-statistics.com/time-series-analysis/time-series-miscellaneous/mann-kendall-test/
What would you like to see in a graph for MK and Sen’s trend?
Charles
Hi Charles,
Is it possible to show the trend line on a plot with the Sen’s slope as well as the trend line using normal excel linear regression (y = mx +b)? I figure I could replace the ‘m’ slope with the Sen’s slope in the equation, but what about the intercept?
Regards,
Clive
Hi Clive,
I have never tried to do this, but probably this depends on what criteria you use to determine the intercept. In other words, there are probably a number of ways to determine the value of the intercept depending on what you are trying to accomplish.
Charles
Hi!!
what does lower and upper indicates in sen’s slope result?
Hi Bhanu,
The webpage shows how to compute an estimate of Sen’s slope. This is an estimate of the true value (i.e. the population value) based on a sample. It can be useful to create a confidence interval of this estimate of the form (lower, upper) where lower and upper are the lower and upper bounds of the confidence interval. E.g. suppose the 95% confidence interval for Sen’s slope estimate of -.2 is (-3.67, -1.00). This means that if we take a large number of samples, then we expect that the true Sen’s slope will be within this interval 95% of the time. Of course, we don’t know the true value of Sen’s slope and we can’t repeat the experiment a large number of times. We only have one sample. We tend to think of this confidence as meaning that there is a 95% probability that the true value of Sen’s slope is within this interval. While this is not actually correct, it does help us interpret the situation.
Charles
Hi Charles,
Is it possible to do the calculation with missing data ? And if so can it be calculated using blank cells or #N/A cells ?
Thanks