Introduction
When the conditions for Pearson’s chi-square test are not met, especially when one or more of the cells have expi < 5 or with 2 × 2 contingency tables, an alternative approach is to use Fisher’s exact test. Since this method is more computationally intensive, it is best used for smaller samples.
2 × 2 Contingency Table Example
Example 1: Repeat Example 2 from Independence Testing using the data in range A5:D8 of Figure 1; i.e. determine whether the cure rate is independent of the therapy used.

Figure 1 – Data and Chi-square test for Example 1
As you can see from Figure 1, the expectation for two of the cells (G6 and H6) is less than 5. Since we are dealing with a 2 × 2 contingency table with a relatively small sample size, it is better to use Fisher’s exact test.
Fisher’s exact test calculates how many different ways the above marginal frequencies can be achieved and then determines the probability that the above-observed cell configuration can be obtained merely by chance.
We can restrict our attention to any one of the cells since once the frequency for one cell is determined, the frequencies for the other cells can be determined from the marginal totals. We choose cell B6 since it has the smallest marginal total (namely 9 in cell D6) and its value is smaller than the other element that makes up this marginal total (namely 7 in cell C6).
Now cell B6 can take any value between 0 and 9; once this value is set the values of the other three cells can be adjusted to maintain the marginal totals.
Calculating the probabilities
The probability that cell B6 takes on a specific value x is equivalent to the probability of getting x successes in a sample of size 9 (cell D6) taken without replacement from a population of size 21 (cell D8) that contains 11 (cell B8) successful choices. This can be calculated by the hypergeometric distribution. Here cells D6 and B8 are cells with the marginal totals corresponding to cell B6 and cell D8 contains the grand total.
Figure 2 contains a table of the probabilities for each possible value of x.

Figure 2 – Fisher exact test for Example 1
Excel formulas used
Thus, e.g., cell L11 contains the pdf value for the count in cell K11 as calculated by the formula
=HYPGEOM.DIST(K11,$B$8,$D$6,$D$8,FALSE)
As observed in Hypergeometric Distribution, the roles of marginal totals B8 and D6 can be interchanged in the above formula.
Users of Excel prior to Excel 2010 can employ the following formula instead
=HYPGEOMDIST(K11,$B$8,$D$6,$D$8)
Cell M11 contains the corresponding cdf value for the value in cell K11 via the formula
=HYPGEOM.DIST(K11,$B$8,$D$6,$D$8,TRUE)
Since a formula for the cumulative distribution function (cdf) is not available in Excel prior to Excel 2010, users of these versions of Excel can insert the formula = L6 into cell M6, the formula =L7+M6 into cell M7, and then highlight the range M7:M15, and press Ctrl-D. Cell M11 will now contain the cdf value for the value in cell K11 via the formula =M10+L11.
Analysis
The Fisher exact test consists of determining whether the probability is less than .05 that at most 2 of those taking therapy 1 are cured (the observed count in cell B6). From cell L17 of Figure 2, we see that the cdf at 2 is .024172 < .05 = α, and so we reject the null hypothesis and conclude there is a significant difference between the cure rates for the two therapies.
There are one-tail and two-tail versions of the test. The p-value for the one-tail test (cell L17) is given by the formula =SUM(L6:L8) or equivalently (for versions of Excel starting with Excel 2010)
= HYPGEOM.DIST(K8,B8,D6,D8,TRUE)
The p-value for the two-tail test (cell L18) is given by the formula
=SUM(L6:L8)+SUM(L14:L15)
where K14 is the leftmost cell in the right tail that has a pdf value ≤ L8 (since .005614 ≤ .022454, but .050522 > .022454). Equivalently, we can use the formula (for versions of Excel starting with Excel 2010)
= HYPGEOM.DIST(K8,B8,D6,D8,TRUE)+1− HYPGEOM.DIST(K13,B8,D6,D8,TRUE)
Worksheet Function
Real Statistics Excel Function: The Real Statistics Resource Pack provides the following worksheet function.
FISHERTEST(R1, tails) = the p-value calculated by the Fisher Exact Test for a 2 × 2, 2 × 3, 2 × 4, 2 × 5, 2 × 6, 2 × 7, 2 × 8, 2 × 9, 3 × 3, 3 × 4 or 3 × 5 contingency table contained in R1.
R1 must contain only numeric values. When R1 contains a 2 × 2 contingency table, there is an optional second argument, tails = 1 (one-tailed test) or 2 (two-tailed test, default). For contingency tables of other sizes, only the p-value of the two-tailed test can be returned.
For Example 1, FISHERTEST(B6:C7,1) = .024172 and FISHERTEST(B6:C7, 2) = .029973.
Limitations
Because the Fisher exact test can be resource-intensive, limits have been placed on the sum of all the cells in the supported contingency tables. These limits are currently set at 2,000 for a 2 × 3 table, 1,250 for a 2 × 4 table, 360 for a 2 × 5 table, 175 for a 2 × 6 table, 110 for a 2 × 7 table, 75 for a 2 × 8 table, 40 for a 2 × 9 table, 320 for a 3 × 3 table, 95 for a 3 × 4 table and 30 for a 3 × 5 table. There are no limits for 2 × 2 tables.
If you want to exceed these limits, you can add a third argument to the FISHERTEST function which specifies how much you want to increase the limit. E.g. if you want to use the Fisher exact test for a 3 × 3 contingency table in range A1:C3 the sum of whose cells is 350, then you can use the array formula =FISHERTEST(A1:C3,,1.1). The 1.1 specifies that you have increased the limit for a 3 × 3 contingency table from 320 to 320 × 1.1 = 352.
Since 350 < 352, the function will run, although it will take a little longer. Similarly, you can use =FISHERTEST(A1:C3,,1.5) for any 3 × 3 contingency table whose entries sum to at most 320 × 1.5 = 480. When the sum is 480, expect the processing to take some time.
3 × 2 Contingency Table Example
Example 2: Determine whether being pro-choice or pro-life is independent of a US citizen’s political party based on the sample shown in range A3:D7 of Figure 3.
You can perform the Fisher exact test by using the worksheet formula =FISHERTEST(B4:C6). The result, as shown in cell H13 of Figure 3, is that being pro-choice or pro-life is not independent of party affiliation since p-value = 4.574E-06 < .05 = α (two-tailed test).
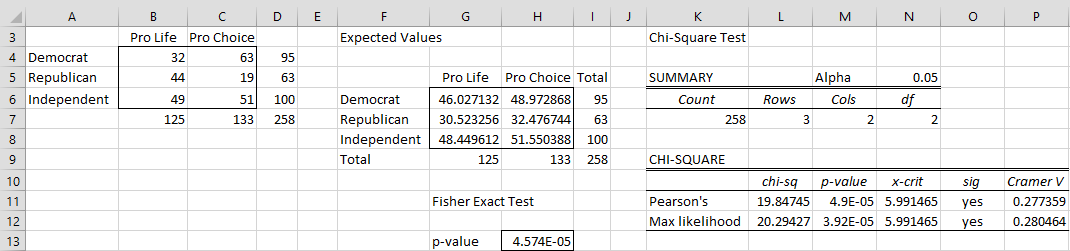
Figure 3 – Fisher exact test for Example 2
Data Analysis Tool
We can also use the Real Statistics Chi-square Test for Independence data analysis tool to get the same result by checking the Fisher Exact Test option in the dialog box that appears (as shown in Figure 3 of Chi-square Test for Independence).
Mid p-value correction
The Fisher Exact Test for 2 × 2 contingency tables can be viewed as too conservative. To address this issue, you can employ what is called the mid p-value correction.
To apply this correction for Example 1, you need to subtract half of the value in cell L8 of Figure 2 from the p-value calculated. This results in a p-value for the one-tail test of .012945 (i.e. .024172 – .022454/2) and .018746 (i.e. .029973 – .022454/2) for the two-tail test.
Real Statistics Function: The Real Statistics Resource Pack provides the following function:
FISHER_MIDP(R1, tails, dbl) = the mid p-value for the 2 × 2 contingency table contained in R1. tails = 1 or 2 (default)
When both of the opposite diagonal elements in R1 are equal (i.e. a11 = a22 and a12 = a21) and tails = 2, instead of subtracting one-half of the term described above, it is often recommended to subtract the full amount. This approach is used when dbl = TRUE (default is FALSE).
Examples Workbook
Click here to download the Excel workbook with the examples described on this webpage.
References
Wikipedia (2012) Fisher’s exact test
https://en.wikipedia.org/wiki/Fisher%27s_exact_test
Ghent, A. W. (1972) A method for exact testing of 2×2, 2×3, 3×3, and other contingency tables, employing binomial coefficients
https://citeseerx.ist.psu.edu/viewdoc/download?doi=10.1.1.135.4796&rep=rep1&type=pdf
Freeman, G. H. and Halton, J. H. (1951). Note on exact treatment of contingency, goodness-of-fit and other problems of significance. Biometrika, 38, 141-149.
https://academic.oup.com/biomet/article-abstract/38/1-2/141/245705?redirectedFrom=fulltext
Agresti, A. (2007) Introduction to categorical data analysis. 2nd Ed. Wiley
https://mregresion.files.wordpress.com/2012/08/agresti-introduction-to-categorical-data.pdf
Chang, C. (2020) Fisher’s exact test p-value calculator
https://www.cog-genomics.org/software/stats
Hi, does it matter which way round a 2×2 is positioned in your calculation sheet? It seems to, but I can’t work out the correct way, or the logic. If I plug this data in, I get 0.03 p-value for the one-tail test, which seems sensible. But the two-tailed p-value is 1.03 which clearly doesn’t make sense.
Female Male
Manager 572 548
Non-manager 1218 1017
If I plug the numbers into an online calculator I get 0.06 which is presumably the 2 tailed value https://www.socscistatistics.com/tests/fisher/default2.aspx#google_vignette
I also get 0.06 if I calculate in R:
fisher.test(matrix(c(572, 548, 1218, 1017), nrow = 2))$p.value
I’d be grateful if you could explain.
Hello Rob,
I also get .06 when I use Real Statistics’ FISHERTEST or FISHER_TEST worksheet functions or the Chi-square Independence data analysis tool with the Fisher Exact test option selected.
What formula or data produced the 1.03 result?
Charles
It is L4+1-HYPGEOM.DIST($C6,$B$8,$D$6,$D$8,TRUE) where L4 is the one-tail result of 0.03. A bit hard to show fully here. Thanks
Hi Rob,
I don’t get a value larger than 1. I get .06 for the two-tailed result.
Charles
I Excel I executed a Fisher Excact Test on a 2×2 contingency table with large numbers. The two-tailed p value = 2 How is that possible? Shall I send the Excel sheet?
Hello Freek,
Yes, that shouldn’t happen. If you email me the Excel spreadsheet, I will try to figure out what is going wrong.
Charles
I have a 2 by 7 contingency table with a total sum of 850. The data are the counts of vaccines received by my 380 samples who have received either 2 doses, 3 doses, or 4 doses. There are 7 vaccine brands we used in making the contingency table. I tried entering the prompt but the result is ‘Grand total > 175 (850) for 5 df.’
My questions are:
Can I still use the p-value of a Chi-square test? I believe my data violates the assumption that each individual must represented once in the study, and individuals cannot be classified in more than one row or more than one column.
What is the alternative course of action?
Hello Louis,
This violates the assumptions of both the chi-square test and Fisher exact test.
Perhaps you can randomly delete multiple samples for the same individual so that the assumptions are met
Charles
Hi Charles,
Thank you for the excellent tool.
I’ve been using it to run fisher’s test on contingency tables up to 4*3 & 3*5 in size. If I try, e.g., 4*4, I encounter an error message that says: “Exceed max df of 8”. What does that message mean and is there a workaround?
Take care,
Brendan
Hi Brendan,
There is no workaround. Real Statistics doesn’t support 4×4 contingency tables. You can use the simulation approach; see
https://www.real-statistics.com/chi-square-and-f-distributions/simulation-chi-square-test/
Charles
Hi
Can you please construct an example with 0 in one of the cells i.e. either b or c. I believe once 0 is introduced in the 2×2 tables, we need to employ Lancaster’s mid-P correction with Fisher exact test. I am not sure how to do it in excel. May I please request for your help.
Regards,
Sid
Hi Sid,
First, let’s look at Example 1 on this webpage. The 1 tail p-value of the FET is .024172. The mid p-value is obtained by subtracting half of the value of cell L8 in Figure 2, resulting in a value of .012945. For the 2 tail FET, the p-value = .029973. To obtain the mid p-value of this test we again subtract half of the value of cell L8 in Figure 2, resulting in a value of .018746.
Now, suppose we change Example 1 by placing 0 in cell B6 of Figure 1 and 9 in cell C6 of Figure 1. Now the p-value of the FET is .000748 (1 tail) and .001119 (2 tails). To obtain the mid p-value we need to subtract half of the value of the 0 entry in the resulting table in Figure 2. This is .000748/2 = .000374. The mid p-values are now .000374 and .000745. The one-tail p-values is halved, although it doesn’t change the significance since it was already a very low value.
Charles
Hi Charles,
I have a 2 by 15 table and performed a fisher exact test for count data. I was able to get a p value of 0.6 using R. Is it possible to know the confidence interval limits? or is it true count data for contigency table more than two, one can not be able to know the limits?
Hi Irene,
For which statistic are you looking for a confidence interval?
Charles
Thank you for another great summary, Charles. Really hoping you’ll publish all of this in a book format at some point.
A quick question: for an A/B test where we track response rates (in %, number of website visitors clicking out of total number of visitors) with an exposed and a control group (each seeing two different versions of the page), what is the best statistical test?
We are comparing proportions and it looks like the t-test, Fisher’s exact test, Chi-square, binomial test, binomial regression and even one-way ANOVA are valid candidates? Which one would you recommend?
Thanks!
Fred
Hi Fred,
It depends on the details. See
https://en.wikipedia.org/wiki/A/B_testing
Charles
Thank you Charles, Wikipedia seems to recommend Fisher’s test. When using Fisher’s test and making unplanned comparisons (for example: let’s say we tested for 5 days and want to compare Thursday vs other days after the experiment was run), what sort of correction would you suggest for the p-value? Would Bonferroni work or is there a better method?
Thanks again!
Fred
Hello, are power calculations typically done for fishers exact test?
G*Power provides a way to calculate the power of Fisher’s Exact test for 2 x 2 contingency tables.
I typically use the power calculation for the chi-square test of independence. See
https://www.real-statistics.com/chi-square-and-f-distributions/power-chi-square-tests/
Charles
Thank you!
| club1
finalclub | 1 2 3 | Total
———–+———————————+———-
1 | 170 34 68 | 272
2 | 102 102 0 | 204
3 | 68 102 34 | 204
4 | 0 68 68 | 136
———–+———————————+———-
Total | 340 306 170 | 816
I have this table, can anyone suggest me how to handle this, a I want to compute fishers exact test in excel by this table
Anushka,
The Real Statistics supports 3 x 4 tables. If you take the transpose of your 4 x 3 table you get an equivalent 3 x 4 table. The only problem now is that the total cell count of 816 far exceeds the recommend cell count of 95, and so the calculations will take a very long time. Perhaps some other statistical software package could better handle your table.
In any case, you can use the simulation approach described on the following webpage
https://www.real-statistics.com/chi-square-and-f-distributions/simulation-chi-square-test/
It will handle cell entries of zero.
Charles
Thankyou so much sir, I will try my best to do it. Will get back to you soon
Does this add on use the Freeman Halton extension of Fishers exact test?
Hello Shane,
I am not sure. The version that I am using does support contingency tables bigger than 2 x 2. Do you have an example that you are sure uses the Freeman Halton extension of Fisher’s exact test?
Charles
Dear Charles,
1- I have a 2×5 contingency table with some cells <5 expected. Therefore I used a Fisher exact test rather than a Chi-square. This brought a significant result (p=0.003). But can I use a correction (Bonforreni or other) to determine the combinaison that brought that difference to be significant?
2- is it correct to perform a Fisher exact test when one of the category is 0?
Thank you
Aline
Hello Aline,
See https://stats.stackexchange.com/questions/7152/how-should-you-handle-cell-values-equal-to-zero-in-a-contingency-table
https://www.researchgate.net/post/What_are_the_alternatives_to_the_Fishers_exact_test_when_assessing_independence_in_an_m_by_n_table_with_low_expected_frequencies_5
Charles
Charles,
I have a 3×3 matrix with a low expected frequency in one cell. However there are over 3300 total observations. I tried putting 11 in as the third argument in your function but it returns ‘Grand total > 2000 (3300)’. Any advice?
Hello James,
For a 3 x 3 matrix, the usual limit is 300 total observations. You can bump this up a bit, but it will be very slow.
The reason why 11 in the third position didn’t help is that there is a maximum 2,000 limit that can’t be exceeded even if you bump up the slow argument.
I can change the 2,000 limit to say 5,000. This would help with a 3 x 2 matrix, but a 3 x 3 matrix would probably be too slow to be of any practical use.
With 3,300 observations, why do you need Fisher’s exact test? The usual chi-square test would usually be quite sufficient.
Charles
That’s interesting. So even if the expected frequency is low (<5) in a cell or two the chi-square is still okay to use? Appreciate your time.
James,
In a 3 x 3 contingency table you can probably get away with one, may be two low frequency valued cells (although not zero). When the sum of the observed values in all the cells is large (> 3300 in your case), a small cell really stands out. It is quite likely that you have a significant result. Ideally, it would be good to use Fisher’s Exact Test, but for such a large number of observations, it would take a long time to complete the calculations.
How many of the 9 cells have an expected value of less than 5 and what are they?
Charles
James,
This is a judgement call and certainly isn’t the case for smaller contingency tables.
Charles
Please help. I get a response of “Grand total > 95 (718) for 6 df” when I used =FISHERTEST(
I made sure not to include the column or row headers but only the cell data.
Hi Charles,
Thank you for providing this resource to us. I have a few questions an hope you can assist. I am trying to create a survey analysis plan and provide templates for fisher exact tests on a survey I created (I can’t send the survey now due to COVID). In my survey, I am looking to compare two categorical variables – whether different types of facilities are engaged in one activity, and if that activity is related to participation in another activity. The survey asked if participants are likely to participate/ provide / etc. in an activity.
For example, I have set up my table in the following two ways and would like to see which one is more appropriate to use. Are either appropriate?
Table 1 would be a table where all participants indicate they are currently participating in these two options (internal, nwhrn planning).
Internal Planning NWHRN Planning Total
HHA
Hospice
Total
Table 2 seems easier for me to understand and interpret for higher-level interpretation, but I do not know if it is possible to set this up for a FISHERS test with the right interpretation:
Internal Planning NWHRN Planning Total
Currently
Planning to
Not Planning to
Total
I’ve also set my alpha to 0.1 to reduce any Type 1 errors
Either is a 2 x 2 contingency table that can be analyzed using Fisher’s Exact Test. Either can be interpreted, but I don’t know whether this interpretation is the one you are looking for.
The usual setting for alpha is .05, but you can use .10.
Charles
Test
Hello,
I calculated Fishertest. For example for
12 24
6 8
it is 1,21
I am using MS Office 2003 and RealStats-2003.
Don’t know what is wrong. Can You help?
Thank you,
Thomas
Hello Thomas,
Yes, there was a bug in the calculation of this value that was fixed a long time ago. Since Excel 2003 is no longer supported by Microsoft, I have not made further bug fixes to this release. The value is correctly determined in the latest releases of Real Statistics. In any case, the
correct p-value for the two-tailed test is .533261 and the p-value for the one-tailed test is .3766993.
Charles
Hi Charles,
I’m french and my english is far from perfect, especially in statistics, so i don’t really understand everything about the use of “fishertest”…
For my thesis I need to calculate p-values with Fisher test for answers to a questionnaire that i summed up in a table and I’d like to be able to do it using Excel. So i downloaded your RealStatisticPack 🙂
What does the function “FISHERTEST(matrix)” return ? Is it the p-value ? Do i have to build a table of the expected values like for the chi-square test ?
Thank you so much for your help, I’m quite lost…
Hello Romane,
You don’t need to build a table of expected values. matrix = the contingency table (without row or column headings). The function returns the p-value.
Charles
Thank you very much ! And thank you for your website 🙂 It will help me so much for my thesis !
Dear Dr Charles,
In the event of having minimum expected count for a 2 x 2 contingency table less than 5 or more than 20% of cells have expected count less than 5, other sources suggested me to use Fisher’s Exact Test instead of Pearson Chi-Square when the assumptions of Chi-Square are not met.
My questions:
1. I noted that Fisher’s Exact Test is for small samples, however I have a big sample (>1000) for my study, how should I move on in this situation? could you please guide me on this?
2. If Fisher’s Exact Test is used, can the effect size of Phi or Cramer’s V be reported?
Thank you
Hello Vincent,
A 2×2 contingency table only has 4 cells. Are you saying that you have a large sample > 1,000, but one of the cells has < 5? 1. For a 2x2 table, you can even use Fisher's exact test even with a very large sample 2. I typically use phi or V in this case, but you can also use the odds ratio as the effect size. Charles
Dear Dr,
Yes, one cell (25%) has <5. Minimum expected count is also below 5.
Alright, I will use Fisher's exact test for 2×2 table.
Just curious, what about 3×2 or bigger table? In the same case where assumptions of Chi-Square are not met, Fisher's exact can't be used, what is the alternative?
Thank you
Vincent,
The situation is similar for a 3 x 2 or larger table, except that the bigger the table the slower the processing to calculate the Fisher Exact value and so it can take a very long time for larger tables. See the following guidelines written on this webpage:
Because the Fisher Exact tests can be resource intensive, limits have been placed by the Real Statistics software on the sum of all the cells in the supported contingency tables. These limits are currently set at 2,000 for a 2 × 3 table, 1,250 for a 2 × 4 table, 360 for a 2 × 5 table, 175 for a 2 × 6 table, 110 for a 2 × 7 table, 75 for a 2 × 8 table, 40 for a 2 × 9 table, 320 for a 3 × 3 table, 95 for a 3 × 4 table and 30 for a 3 × 5 table. There are no limits for 2 × 2 tables. You can use the Fisher Exact test for tables with higher cell totals, although the processing will get slower.
Charles
Dear Dr,
Thank you very much for your sharing and guidance.
hello, i have a 5 by 6 table, is it possible to calculate fishers exact test?
Hello David,
I am sure that it is possible, but Real Statistics doesn’t support Fisher’s exact test for 5 x 6 tables.
Charles
Hey Charles,
Are you aware of any tools/software that support Fisher’s exact tests for 3 x 6 and 5 x 6 tables?
Thanks
Probably your best bet is to use R.
Charles
Hi charles
I am very ignorant in statistics and your website is helping me a lot to understand what is behind many statistical tests and how they work. I downloaded the Real Statistics resource package and used Fisher’s exact test function to calculate the importance of differences between pairs of samples. The problem I am addressing is trying to know if the differences I see between the regions in terms of the number of proposals submitted are directly related to the total number of researchers in the region. One might think that it should be so, however, there may be other factors that could affect the final decision to apply or not. The fact is that in some regions the actual number of presentations differs from the expected number (depending on the number of researchers). I wanted to know if those differences are significant or not. I used Fisher’s exact test, instead of the Chi square, because in some cases the number of proposals is less than 5. And it works perfectly. However, in some cases, the p-value given by the test is negative, and I don’t know how to interpret it. Of the formula used to calculate the value of p (which only uses factorials), it should never be negative.
I give you a (real) example of this:
The contingency table would be:
total / region 1
number of submissions: 825 / 58
number of researchers: 77068 / 977
The p value I got is -4.44089E-16
Could you please tell me what am I doing wrong?
Thank you very much and thank you also for your help with the blog and the Real Statistics Resource Pack.
Javier
Javier,
You are correct that the value should not be negative. However, -4.44089E-16 is so close to zero that you should simply assume that p-value = 0. With numbers this small sometimes Excel reports a negative number, although for all practical purposes you can assume that the value is zero (assuming that you didn’t make an error).
Charles
Thank you very much for your response and for being so fast answering! I really appreciated your help.
Best regards from spain
Javier
Hi Charles,
I have a question regarding using Chi-square and Fisher test. I have a data that have two groups (Alzheimer disease AD, non-AD) and 6 categories of response received from these two groups(AD and Non-AD). The categories of response are(yes-answer, yes-explanation, no-ans, no-explanation, backchannel, clarification question).the response categories represent frequency of how many questions are answered with only yes, yes and explanation etc. but the problem is that few frequencies are less that 5.
Should I use Fisher’s exact test and a table of 2×6? to check either the responses on these categories are different among two groups(AD and Non-AD)?
If some of the cells are less than 5, then you are usually better off using Fisher’s test provided the total sample size is not too big (in which case it might take a long time to do the calculations).
Charles
Thanks Charles. Can you please guide me how I can perform fisher for such data as the table would be 2×6? Mostly help is available for 2×2 table to perform fisher test.
Hello Charles,
I’d appreciate your advice on the following:
I have 3 groups, A, B, and C, of unequal size (21, 13, & 11 subjects respectively). A number of patients in each group have a certain disease (0, 3, and 0), respectively. I would like to know whether being a member of group A, B or, C predisposes subjects in that group to the disease in question.
1) Should I do two sequential Fisher’s exact tests to compare group A to group B and group C to group B, with Bonferroni’s correction? There is obviously no statistical difference between groups A and C, so obviously no point in comparing these two.
2) Any problem doing Fisher’s test with 0 in one cell?
Thanks very much.
Joel
Hi Joel,
1. Assuming that the chi-square test for independence (or the Fisher test) is the correct test, you can do follow up testing as you have described. This also assumes that you have eliminated the need to test A and C before you collected (or at least looked at) the data. If not, then you need to assume there are 3 tests and not 2.
2. Fisher’s exact test also works when a cell has a 0 value.
Charles
Thanks very much.
Joel
Hi Charles.
Error occured during FISHERTEST(A1:C3,,1.1) or FISHERTEST(A1:C3,,1.5).
Excel (2013) doesn’t understand “,,” – twice commas after array.
Cheers,
Boris_V KPEXHOB (Moscow, Russia)
Hello Boris,
That should work unless comma is used as the decimal symbol for your computer, in which case you need to use a semi-colon instead of a comma, i.e.
=FISHERTEST(A1:C3;;1,1)
What error message did you get? Did you still get the error message when you put the number 2 between the two commas?
Charles
Hi, Charles.
Decimal point is a delimiter.
I repeat Example 1 similarly as Your,
but in Example 2 “Grand total >100(258) for 6 df” – is a message in a cell.
All my thinkable combinations (semicolon, comma, decimal point) are poor.
Regards,
Boris
Hello Boris,
For Example 2,the contingency table is 3 x 2 and so df = (3-1)(2-1) = 2. Since the error message you got states that df = 6, perhaps you included the headings in the array. For Example 2, the formula to use is =FISHERTEST(B4:C6). You don’t even need to use the slow argument.
Charles
Hey,
I need to do a Fisher Exact Test rathe than a Chi-Square Test, because I have some cells were n<5.
But I don't know how to calculate the effect size. Can I still use the phi coefficient or Cramers V? (Because their both computed with the Chi-Square…) ?
Thanks.
Hello Julie,
I don’t know for sure whether this is valid, but this is the approach that I have used in the past.
Charles
Hey Charles,
I have a question. I have used the Fisher Exact Formula to calculate the p values of my contingency tables (2×2; 3×2; 3×3). Now I need to measure the intensity and direction of the relationship. Which tool do you suggest?
For the 2×2 contingency tables I used the phi coefficient (with a formula possible for a 2×2 contingency table by hand). But for the 3×2 and 3×3 contingency table I don’t know how to do….
Do you have any suggestions for measuring the intensity and direction (positive or negative) of the relationship after using the Fisher Exact Formula (FISHERTEST)?
Julie
Julie,
For a 2×2 table you can use phi and for the others you can use Cramer’s V for the others. Since you are using Fisher’s exact test, you need to create a pseudo chi-square stat from the Fisher’s exact test in order to calculate phi and Cramer’s V. This is done for you using the FISHER_TEST function.
Charles
Hey,
I wondered if it is possible to run a Fisher exact test with the excel function FISHERTEST for a 3×2 contingency table?
I tried to dot it, but only the 2×2 contingency table works….
Hi Julie,
I just tried using this function for a 3×2 contingency table and it works. I can think of the following possible problems:
1. You are using an old version of the Real Statistics software. If you enter the formula =VER() in any cell you will find the software release. The latest is 6.1, but this capability was added several releases ago.
2. You have included the row and/or column headings from the contingency table. FISHERTEST only works with numeric data and so you can’t include the headings.
3. You have exceeded the maximum sample size. The sum of the values in the 6 cells of a 3×2 contingency table must be less than 2000.
Charles
Thank you very much Charles! It works now, the problem was I didn’t had the new Excel version. So, I changed it and now it works. Thank you soo much for answering so fast! You saved my day!
Julie
Glad I could help, Julie.
Charles
Good evening, Dr. Zaiontz,
First, I wanted to thank you again for your “Real Statistics” program and your website that gives in-depth insight into statistical analysis.
I have some questions for regarding the use of Fisher’s Exact Test on a data set I am analyzing.
As some background, I am analyzing the results from a tag retention study in Flounder. For our study, two tag types (“dart” tag or “t-bar” Tag) were available to be implanted into these fish. Each fish was tagged twice (The dorsal region and the caudal region) with either tag type (i.e. no “mixing” of tag types on one fish). After 120 days, these fish were removed from the tank and sacrificed in order to ascertain the effectiveness of each tag. Note: I could only focus on “categorical characteristics” as the study was primarily focused on whether the tags could remain affixed for “x” days in a given tag location.
The results are given in 2×4 Table
Dart Tag T-Bar
Both tags present 3 12
Dorsal Tag Only 2 2
Caudal Tag Only 3 2
Both Tags Lost 9 4
I used the Chi-Square Test option with a Fisher’s Exact test and had the following results:
Chi-Square p-value 0.0621; Fisher’s Exact: 0.05 (Alpha set @ 0.05)
I was wondering if I was correct in using this particular statistic test. Also, given, these results, should I assume that there is a statistical significance in the retention ability of the two tag types (given the p-values from the Fisher’s test)?
Thank you again for your help.
Hi Paul,
The calculations look correct. Since the p-value is larger than .05, there is no significant difference between the two tag types. Note that since a number of the cell counts is quite small, you are better off using the Fisher exact result which yields a p-value = .050129, just a little more than alpha = .05, and so the result is marginal. It is entirely possible that you would see a difference if the experiment is repeated many times. The effect size is .45 which suggests a difference (at least based on this sample).
Note too that this test doesn’t take the order into account. You could instead test # of lost tags (with values 0, 1 or 2) vs tag type. See the following webpage for more information about this approach:
https://www.uvm.edu/~dhowell/StatPages/More_Stuff/OrdinalChisq/OrdinalChiSq.html
Charles
Dr Charles Zaiontz
First of all, I would like to thank you for this huge gold mine you share with people through your wonderful website. The work you done is just absolutely outstanding not only the excel module you created and other stuff but also the theoretical aspects of the statistics in general, that are very clearly explained and illustrated with practical examples. Chapeau bas !
I noted a small error during the lecture of the paragraph which deals with the computation of the two tails p-value of the exact Fischer test, we can read (Equivalently, we can use the formula (for versons of Excel starting with Excel 2010), as “i” is missing.
Best regards
Jean
Jean,
I am very pleased that you are getting value from the website.
I read that you have found an error, but I haven’t been able to locate the error. Where is the missing “i”?
Charles
Dr Zaiontz
Please find below a screen capture of the error
https://image.ibb.co/njSosS/capture.png
Ps : the capture will be deleted once the correction would have been done
Jean
Jean,
Thanks for catching this error. Also for pinpointing the error for me since i just couldn’t see it.
I appreciate your help in improving the quality of the website.
Charles
Thanks for this tool. Is there no way to make it work with a single row across 4 columns, where the first two columns would be equivalent to the top 2 cells of a 2×2 table, and the 3rd and 4th column would be equivalent to the bottom 2 cells?
Jon,
Sorry, but this is not supported.
Charles
When I choose Chi-Squared test in RealStats, I don’t have an option to use Fisher’s exact test.
Brett,
What version of the Real Statistics software are you using? All the latest versions have a Fisher exact test option. You can find out the version number by entering the formula =VER()
Charles
Thanks Charles, I get the following:
4.4.3 Excel 2010/2013/2016
Brett,
That’s a pretty old release. The capability you are interested in was added in April 2016 after the release you are using. I suggest that you upgrade to the latest release. Actually I plan to issue the next release in the next few days.
Charles
Thanks!
very informative
Hi Charles
I have data for 3 groups of people and 10 themes and I want to see if there is a significant difference between the 3 groups. I understand this is called a 10 x 3 matrix.
I would like to use the Fisher exact test.
Is there an excel ‘add in’ that I can use to do this?
If so could you post me the link, statistics are not my forte 🙂
Elle
Elle,
Why do you want to use Fisher Exact Test as opposed to Chi-square Test for some other test? In any case, I don’t know of an Excel version of a 3 x 10 Fisher test. The Real Statistics software can handle 3 x 3 tables.
Charles
Hi Charles
I have data for two groups ( exposed and non exposed to silica ) and I compare between the two groups by using fisher exact test but i can not detect p value for the variable (age). how can i do this?
age group 1 group 2
11-20: 0 2
21-30: 2 3
31-40: 1 2
41-50: 3 2
50-60: 2 1
> 60 : 1 0
This is a 6 x 2 contingency table. The Real Statistics software supports 5 x 2 tables but not 6 x 2 tables. If you combine the > 60 row with the row before it, you have a 5 x 2 table.
Charles
ok, thank you
but, what is the test?
11-20: 0 2
21-30: 2 3
31-40: 1 2
41-50: 3 2
> 50 : 3 1
The test is the one you asked for, namely the Fisher exact test, as described in the second part of the referenced webpage.
Charles
Hi Charles
Thank you for that.
I had intended to use the chi square but that is not possible as I have to many cells with 5 or under.
Hi Charles,
Can the Fisher test and hypergeometric distribution work with multiple binomial variables in a multidimensional (2^k) contingency table, or is it restricted to just two variables/dimensions? Is there an equivalent test and distribution for more than 2 binomial variables, especially where the frequency of some cells may be very low?
Kelvin,
If you are referring to m x n x d contingency tables, I guess that you could create a Fisher-like exact test, but I have not seen this done.
The Fisher exact test is so computationally intensive that even larger 3 x 3 or 2 x 4 tables are slow, I would expect that a 2 x 2 x 3 table would be very slow.
Charles
Thank you, Charles. So if Fisher’s test can’t work, I’m still struggling with this question of how to test for simultaneous correlation between multiple binomial variables?
Kelvin,
When you say binomial variables, do you mean (1) variables that have a binomial distribution or (2) dichotomous, i.e. only take one of 2 values?
Charles
2) dichotomous
Kelvin,
I can think of the following approaches for extending Fisher’s Exact Test to more than two dimensions
1. Use log-linear regression. This is described on the website for the three-dimensional case
2. Use logistic regression. This may be the easiest way of tackling the problem.
3. Write your own extension to Fisher’s exact test. You could probably do this for three dimensions,but the calculations would probably be quite slow.
Charles
Following your precious info and links, I realized a small implementation of the two-sided 2 x 3 test in excel.
I ‘d be delighted if you would accept it for testing.
Thank you for your amazing site.
Paolo
Paolo,
I would be delighted to accept it for testing. My email address can be found on the Contact Us link.
Many people have asked for 2 x 3, 3 x 3, etc. versions of the test and I haven’t had time to implement them yet. Your help would be appreciated by a lot of people, including me.
Charles
Hi Charles,
I downloaded your Resource Pack for Excel 2010. However when I used the FISHERTEST function on this 2×2 table:
3 11
7 1452
I get a P value of 1 when it should be 0.001.
Please advise
Thank you
Hoang
Hoang,
Yes, you are correct. The value calculated by the FISHERTEST function is not correct for this data. I will check to find out where the problem is.
Charles
Hi Hoang,
I have now fixed the bug in the FISHERTEST function. If you download the latest version of the software, Release 4.4.3, the function should give the correct answer. Thanks again for your help.
Charles
Thank you!
Hi Charles,
I have data from an experiment where I determined the frequency of 4 different categories (phenotypes) in a control group and want to compare the distribution to treated groups. The phenotypes are categorical and mutually exclusive. Categories are different and cannot be pooled.
For example, the control group has the following frequencies for a total of 20 observations:
A= 0
B= 0.95
C= 0.05
D= 0
If I look at two treated groups, they would show something like this:
Group 1: n= 70
A= 0
B= 0.76
C= 0.24
D= 0
Group 2: n=90
A= 0.2
B= 0.26
C= 0
D= 0.54
I calculated Confidence intervals at 95%, but how do I assign a statistical significance to the differences that I see? How do I compare to control or between samples? If these were numeric data, I would have done an ANOVA a long time ago, but this is not the case.
I would appreciate any help you could provide!
Diego
Diego,
It really depends on what you mean by “how do I assign a statistical significance to the differences”. Perhaps you are looking for a chi-square test of independence. In this case your would data look like
Cat..Control..Treat 1…Treat 2
A……….0……..0……..18
B………19…….53……..23
C……….1…….17………0
D……….0……..0……..49
Unfortunately, you can’t use the chi-square test since many of the cells are less than 5.
Please explain more carefully what you are trying to test.
Charles
Hello, can you use this for a bigger contingency table? (e.g. 2×5)
Hello Noelle,
No. This test applies only to a 2 x 2 table. There are versions for tables as large as 2 x 5, but I haven’t implemented them yet. The following is a reference for how to implement such a test in Excel.
http://www.amstat.org/sections/SRMS/Proceedings/y2001/Proceed/00541.pdf
Charles
It works a treat, Charles. Thanks so much.
John
John,
I just learnt of another error in the FISHERTEST function (a roundoff error). It probably very rarely occurs, but in any case I have corrected the problem, and so if you download the Release 4.02, which just went online a few minutes ago, you will have the corrected version.
Charles
Hi Charles,
Thanks for the prompt response. I downloaded from the section quoted below which is found on https://real-statistics.com/free-download/real-statistics-resource-pack/real-statistics-resource-pack-excel-2007/
“If you accept the License Agreement, click here on Real Statistics Resource Pack to download the latest version of the resource pack that accompanies this website (Release 3.8.1). This software is compatible with Excel 2007.”
Regards, John
John,
I don’t understand why you are having this problem. I am not seeing it on my computer. I plan to issue a new release of the software this week. I will make sure that this problem doesn’t occur with Excel 2007 (at least on my computer). Hopefully everything works fine on your computer with the next release of the Real Statistics software.
Charles
Many thanks for your efforts in looking, Charles. Let’s hope the new release works for me. If it doesn’t then it would be unfair of me to take yet more of your time.
John
John,
I expect to issue the new release tomorrow (Friday).
Charles
John,
Sorry, but today’s release does not fix the problem that you raised with the FISHERTEST function. The good news is that I have now identified the problem. What made it hard to find the problem was that the Excel HYPEGEOMETRIC function seems to give a different answer in Excel 2007 from that in Excel 2010/2013. I hope to put the fix in the software in the next few days. Note that the problem only arises in the two-tail test (not in the one-tail case).
Charles
Great news, Charles. Thanks again. Please let me know when you when you have fixed it.
John
John,
It should work in the latest version for Excel 2007, which I just put on the website.
Charles
Hi Charles,
I’ve downloaded Realstats for Excel 2007. A Fisher test on
1 12
17 53
gives an answer of 0.2800, which I trust is correct, and shows things are working.
But a test on
13 45
5 20
gives an error: #VALUE! with the explanation alongside: ” A value used in the formula is of the wrong data type”
If I change the 20 in this example, then a count of 13 or less gives a numeric answer but 14 or above gives a #VALUE error.
Cheers,
John (UK)
John,
I am not seeing this error message. I get a value of 1 in a two tail test and a value of .527 for a one-tail test. I fixed a bug in this function in Release 3.7. Are you using the latest release? If not this problem should be resolved if you upgrade to the latest release. If you are using the latest release, please let me know and I will investigate the problem further.
Charles
Dear Charles,
after installation I get with ctrl-m a list of statistic functions. But the FISHERTEST is missing.
What have I to do to add it to the list?
Thanks a lot. – Anyway your Add-in is great.
Christian
Christian,
FISHERTEST is a function and so you can use it just like any other Excel function (see example at the end of the referenced webpage).
Charles
Help! =Fishertest isn’t working in excel. I see a #name error
I did a search and cannot find the fishertest function
only fisher and fisherinv
Hello Des,
You need to install the free Real Statistics add-in to Excel to use the Fishertest worksheet function. See
https://real-statistics.com/free-download/real-statistics-resource-pack/
Charles
Dear Charles,
I have downloaded the Real Statistics Resource Pack today – I have Excel 2011 for Mac. Like EMM, Rachel and Kristin, I do not seem to have FISHERTEST in the list of Realstats functions. When I directly type =FISHERTEST(B2:C3,1) or =FISHERTEST(B2:C3,2) for a 2×2 contingency table, I also get #VALUE! as a result. However, when I omit the tail and merely type in =FISHERTEST(B2:C3) I do get a result. Could you tell me how I can find out whether 1 or 2 tails have been used in the calculation? And how can I control the number of tails when I fail in the way described above?
Kind regards,
Maarten
Maarten,
If you leave out the second argument, it defaults to two-tails (which is the preferred test). I don’t know why inserting the second parameter results in an error in the Mac version of the software. I just checked and this is not the case for the Windows version of the software. Unfortunately, I don’t have access to a Mac computer at present so that I can resolve this problem. Once I get access to a Mac I will issue a new release which provides access to the 1-tailed test result.
Charles
Charles,
Many thanks for your quick reply. I am also able to run Windows separately on my Mac via VMWare Fusion. I have downloaded the Real Stats Resource Pack in Windows, and, as you mentioned, it does indeed work fine in there.
On another note, could you please tell me which method you used to compute the 2-tail P value? In my understanding there are three different methods to compute this?
Maarten
The function FISHERTEST does not seem to work for large values (I tried 4916/201/68/8)?
Gerald,
The problem is not with large values. In fact it even occurs for 3/2/2/3. The problem is that in the two-tailed test when the right and left critical regions overlap a p-value greater than 1 occurs since the overlapped area is counted twice. In these cases the correct p-value = 1. I will correct this in the next release, which I expect to deliver in the next day or two. Thanks again for finding the problem.
Charles
I’m having this problem too – for some reason it will only allow me to perform the one-tailed Fisher’s Exact Test. I would really like to use the two-tailed test, if someone can shed some light on this…
Rachel,
I just retested the Real Statistics function =FISHERTEST(R1, tails) and it works properly for tails = 1 or 2. There was a problem several months ago, but it was resolved several releases ago. If you are not using a recent release I suggest that you download the latest release of the software.
Charles
I just downloaded the latest version of the software and am using it on some data in Excel. Interestingly, it worked on the first 2 x 2 table I used it on. However, on the next 2×2 table I tried it on, it gives me the #VALUE! error message. I wonder if it’s something to do with the numbers?
My first 2 x 2 table had the following numbers (from left to right top row, then bottom row): 82, 248, 75, 28
My second 2 x 2 table had the following numbers: 12, 179, 145, 97.
Any thoughts? I’m doing a two-tailed analysis. Thanks!
Kristin,
It worked on my computer. I got 3.16E-18 for the first problem and 2.76262E-34 for the second problem.
Charles
Thank you so much for your help and your brilliant add-in!