Introduction
Another way of evaluating the fit of a given logistic regression model is via a Classification Table. The Real Statistics Logistic Regression data analysis tool produces this table. For Example 1 of Comparing Logistic Regression Models the table produced is displayed on the right side of Figure 1.
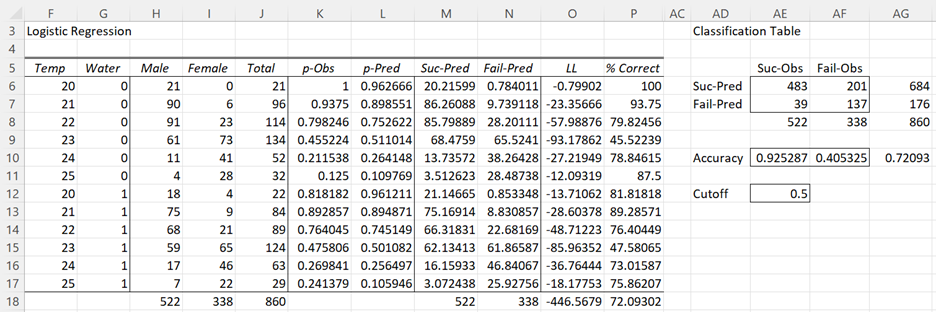
Figure 1 – Classification Table
The table shows a comparison of the number of successes (y = 1) predicted by the logistic regression model compared to the number actually observed and similarly the number of failures (y = 0) predicted by the logistic regression model compared to the number actually observed.
Elements of the Table
We have four possible outcomes:
True Positives (TP) = the number of cases that were correctly classified to be positive, i.e. were predicted to be a success and were actually observed to be a success
False Positives (FP) = the number of cases that were incorrectly classified as positive, i.e. were predicted to be a success but were actually observed to be a failure
True Negatives (TN) = the number of cases that were correctly classified to be negative, i.e. were predicted to be a failure and were actually observed to be a failure
False Negatives (FN) = the number of cases that were incorrectly classified as negative, i.e. were predicted to be a failure but were actually observed to be a success
The Classification Table takes the form

where PP = predicted positive = TP + FP, PN = predicted negative = FN + TN, OP = observed positive = TP + FN, ON = observed negative = FP + TN and Tot = the total sample size = TP + FP + FN + TN.
Example
For the data in Figure 1, we have
TP = 483 (cell AE6), which can be calculated by the formula =SUMIF(L6:L17,”>=”&AE12,H6:H17)
FP = 201 (cell AF6), which can be calculated by the formula =SUMIF(L6:L17,”>=”&AE12,I6:I17)
FN = 39 (cell AE7), which can be calculated by the formula =H18-AE6
TN = 137 (cell AF7), which can be calculated by the formula =I18-AF6
Here cell AE12 contains the cutoff value of .5. Predicted values (in column L) greater than or equal to this value are classified as positive (i.e. predicted to be a success), those less than this value are classified as negative (i.e. predicted to be a failure). TP is simply the sum of all the values in column H whose predicted probabilities in column L are ≥ .5.
The cutoff value is specified in the Logistic Regression dialog box (see for example Figure 4 of Finding Logistic Regression Coefficients using Excel’s Solver).
Note that FP is the type I error and FN is the type II error described in Hypothesis Testing.
Other Concepts
We now can define the following:
True Positive Rate (TPR), aka Sensitivity = TP/OP = 483/522 = .925287 (cell AE10)
True Negative Rate (TNR), aka Specificity = TN/ON = 137/338 = .405325 (cell AF10)
Accuracy (ACC) = (TP + TN)/Tot = (483 + 137) / 860 = .720930 (cell AG10)
False Positive Rate (FPR) = 1 – TNR = FP/ON = 201/338 = .594675
Positive Predictive Value (PPV) = TP/PP = 483/684 = .70614
Negative Predictive Value (NPV) = TN/PN = 137/176 = .77841
The overall accuracy of the logistic regression model is a measure of the fit of the model. For Example 1 this is .720930, which means that the model is estimated to give an accurate prediction 72% of the time.
Note that the accuracy of each outcome is given in column P of Figure 1. E.g. the accuracy of Temp = 21 and Water = 0 is 93.75% (cell P7), which can be calculated by the formula
=100*IF(L7>=$AE$12,H7/J7,I7/J7)
The total accuracy of the model (cell P18) can then be calculated by the formula
=SUMPRODUCT(P6:P17,J6:J17)/J18
The value of cell P18 is .720930, which is the same value we obtained in the classification table (cell AG10).
Examples Workbook
Click here to download the Excel workbook with the examples described on this webpage.
References
Kaggle (2023) Classification table – confusion matrix. Logistic regression using R
https://www.kaggle.com/code/benroshan/part-8-logistic-regression-using-r
MedCalc (2023) ROC curves
https://www.medcalc.org/manual/roc-curves.php
Using the results in the Classification table-overall percentage, how high should it be to make the model considered as an efficient or good model?
Hello Chloue,
I don’t know of any specific guidelines for what level of accuracy makes for a good model. It all depends on the scenario that you are modeling. Clearly accuracy of 100% is perfection and an accuracy of 50% just means the model is no better than flipping a coin. Obviously, somewhere in between is what you are aiming for, but there is no specific number.
Charles
Sir
I have both training data and test data.
how do i implement classification accuracy based on test data of a model derived with training data ?
Hello Daniel,
Suppose that you have data for logistic regression. Build your model using the training data. Then test your model using the test data. Now for the test data you have both the predicted y values (from the model) and the observed values from the test data, and so you can build the classification table.
Charles
This was the best thing i’ve ever read.
If i pass my dissertation it is solely down to this page
Hi Lauren,
Thank you very much. Best of luck on your dissertation.
Charles
thank you I appreciate you!
Suppose the average success rate in the sample is .8, meaning 80% of the observations show the value of 1 for the dependent variable. How does this affect the choice of the cut-off value, say using ,8 rather than .5?
Heather,
You can choose any cut-off you like.
Charles
I have two variables, Standard and Test i need ROC curve for these two variable. For that i want Sensitivity and (1-Specificity) on various cutoff. Can you please tell me how to calculate cutoff value?
Standard and Test both are binary variables.
I need cutoff points, please tell me how to calculated cutoff values!
Dinesh,
The cutoff values are user-defined. You can select whatever value serves your purposes.
Charles
How to perform ROC analysis for significant predictors in Linear Regression? Can you give any idea???
Can you specify more precisely, what ROC analysis you want to do? For binary logistic regression this is clear; it is less clear for linear regression.
Charles
Thank you so much for your help here! I’ve performed the logistic regression, but unfortunately the accuracy of my classification table/regression is very low for my false positives and false negatives. What can I do to improve this?
Classification Table
Suc-Obs Fail-Obs
Suc-Pred 590 267 857
Fail-Pred 82 157 239
672 424 1096
Accuracy 0.87797619 0.370283019 0.681569343
Cutoff 0.5
Gilly,
The accuracy is not that bad, but in any case there really isn’t anything you can do, except use some other statistical model.
Charles