In Goodness of Fit, we describe how to use the chi-square test to determine whether a given sample conforms to a particular distribution. We will now describe some Real Statistics functions that make it easier to carry out such tests.
Worksheet Functions
Real Statistics Functions: The following array functions are provided in the Real Statistics Pack. R1 contains a frequency table, i.e. a range with two columns. The first of these columns contains data values, and the second contains the corresponding frequencies.
GOFTEST(R1, dist, lab, iter): returns an array with the parameters for the distribution specified by dist, the p-value of the chi-square goodness of fit test, and the data value in R1 that has the lowest expected frequency value, followed by this expected frequency value.
GOFTESTExact(R1, dist, lab, param1, param2): returns an array with the param1 and param2, the p-value of the chi-square goodness of fit test for the distribution specified by dist, and the parameter values and the data value in R1 that has the lowest expected frequency value, followed by this expected frequency value.
dist takes one of the values shown in Figure 1.
 Figure 1 – dist values
If iter = 0, then the method of moments is used to estimate the unknown parameters; when iter = -1 then the pure method of moments is used; if iter = -2, then the regression approach is used (this is only valid for the Weibull distribution) and if iter > 0 (default 20) then an iterative approach is used with iter many iterations (except that no iteration is actually performed for the normal or exponential distribution; instead the result is the same as iter = -1).
If lab = TRUE (default FALSE), then an extra column of labels is appended to the output from ADTEST to yield a 7 × 2 range instead of a 7 × 1 column range.
Example
Example 1: Determine whether the data in the frequency table in range A3:B11 of Figure 2 is normally distributed based on a chi-square goodness of fit test.
The test can be done using the array formula =GOFTEST(A4:B11,1,TRUE,0) with the result shown in range F5:G11 of Figure 2. The formula specifies that the value of the standard deviation to use is the one based on the unbiased method of moments. Since p-value = .002686, we reject the null hypothesis that the data is normally distributed.
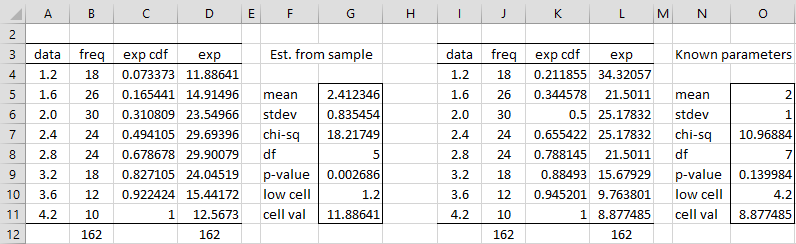
Figure 2 – Chi-square goodness of fit test
Note that the output also shows that the cell with the smallest expected frequency value corresponds to the data element 1.2 (cell A4) and that this frequency value is 11.8841 (cell D4). This is useful since we prefer not to have cell values less than 5 (and recall that columns C and D are output from the GOFTEST function.
If instead, we want to test whether the data in range A3:B11 follows a normal distribution with mean 2 and standard deviation 1, we use the formula
=GOFTESTExact(A4:B11,1,TRUE,2,1)
This time we explicitly identify the population mean and standard deviation. The output shown in range O5:P11 shows that p-value = .139984, and so we conclude that the data is a fit for this specific normal distribution.
Data Analysis Tool
You can also perform the Chi-square Goodness-of-Fit Test via the Goodness of Fit data analysis tool. Click here for more information about this data analysis tool.
Examples Workbook
Click here to download the Excel workbook with the examples described on this webpage.
Links
References
Zar, J. H. (2010) Biostatistical analysis 5th Ed. Pearson
Agresti, A. (2013) Categorical data analysis, 3rd Ed. Wiley.
https://mybiostats.files.wordpress.com/2015/03/3rd-ed-alan_agresti_categorical_data_analysis.pdf
Howell, D. C. (2010) Statistical methods for psychology (7th ed.). Wadsworth, Cengage Learning.
https://labs.la.utexas.edu/gilden/files/2016/05/Statistics-Text.pdf
Charles,
In Fig. 2 the first “exp” value from the “Known” parameters (34.32) doesn’t look like part of a normal distribution when graphed. I redid the exp column using the “normdist” function with a mean of 2, a stdev of 1, and scaled so that the sum of the exp values is 162. This resulted in the first exp value to be 22.8 and the Chi-square p-value to be 0.002. Is this method correct?
Thanks
Hello Dave,
Sorry for the late response.
The values in column L are the expected counts, including 34.32. These are not necessarily normally distributed.
I haven’t followed your reasoning, and so I can’t see why this approach should be correct. Sorry that my response is not more supportative.
Charles
Charles, love this site and your tool.
I’m trying to use your tool to evaluate whether two group means are different. I’ve already calced the means in another program, so all i have is the mean and the number of responses per group. I’d like to run a t-test but I can’t import the whole dataset into excel. Do I have an option for running it with the add-in?
Jennifer,
You can’t run a t-test with only the means and the number of respondents. This is true in general, not just for the Real Statistics add-in.
You need the standard deviations as well.
Charles
Hi, i have a count data of dead individuals exposed to different types (categorical) and concentration of contaminants for different exposure time. So I had type, concentration and time as a variable with 4 levels each. If I want to do goodness of fit, how should I arrange my data to get the stats done by the software. Data is with replications, should i use the average numbers?
I shall appreciate the quick response.
Hello Rabia,
Can you describe more specifically what you want to fit your data to? A specific known distribution?
Charles
Hi Charles
Thank you for your reply.
I dont have much knowledge of statistics. My advisor suggested me to do goodness of fit and I am just myself confused about what to do and how to do. In view of your immense experience and knowledge, can you suggest me that what type of fit suits to data type described previously? I was just doing google and was thinking about chi square, but I am not sure if it is the right one.
Rabia,
It really depends on the nature of your data, but a chi-square test is commonly used. See
Goodness of Fit
Charles
Doc, good morning, what goodness-of-fit test can I apply to determine if a data set has a Poisson distribution?
Thanks
Gerardo,
This depends on how your data is organized, but see the following webpage for a few of the approaches:
https://www.real-statistics.com/chi-square-and-f-distributions/goodness-of-fit/
Charles
Hello Dr.Chales,
I wonder if I did something wrong ? I use the GOFTEST function and GOFTESTExact both of them did not give me the value as shown in column C D (exp cdf and exp). Would you please give some suggestion? Thank you
Eddy,
If you email me an Excel file with the data and test results you have obtained, I will try to figure out why you didn’t get the results shown in the figure.
Charles
Hi Charles,
Many thanks for this wonderfull web site.
My experience is the number of sheep observed and the number infected by a parasite. I used the Chi-2 test to determine if there is a difference between the number infected in different seasons. I used 2 columns (1st for number observed and 2nd for number infected).
Now, I would like to do the same test but using the infection intensity (counting the number of eggs per sheep). I would like your opinion. I used 2 columns: 1st for observed number and 2nd for average number of eggs found.
Observed Infected
Summer 758 182.0
Winter 257 108.06
Is it correct?
Can i compare between observed number and eggs number?
The goal of the study is: is there a difference on infection intensity between seasons?
Thank you
Abdelkader,
This looks like a reasonable approach with one change. You should use the following 2 x 2 contingency table
Not Infect Infected
Summer 576 182
Winter 149 108
I don’t understand how you could have 108.06 infected people in winter. Who is this 6% of a person? I rounded it down to 198.
Charles
Many thanks for your reply,
I also need to study the infection intensity (eggs number). I have to compare with what?
I think to compare the mean eggs number for a season with the mean eggs of 4 seasons (1year). Like example below:
yearly mean eggs season mean eggs
Summer 184.34 200.56
Winter 197.62 200.56
Is it correct?
Thanks,
This could be another chi-square test.
Charles
Hi Charles,
I have categorical independent and dependent variables, but the problem is that the covariate is on interval level. Can I still use Chi-square (as I’m not sure if covariate not on categorical level violates the assumption of Chi-square), or should I use Regression instead? Thank you and hope you have a great day.
Winnie,
See the following webpage regarding this issue>
https://www.uvm.edu/~dhowell/StatPages/More_Stuff/OrdinalChisq/OrdinalChiSq.html
Charles