Objective
We explore the problem of determining whether a sequence with two possible outcomes is random, especially from the point of view that the runs are random. We begin with an example.
Normal Approximation Approach
Example 1: 40 people were selected at random in the following order MMFFF FMFFM MFMMM MFFMM FMFFM MMMF FMFMM FFMMMF. Assuming the population has 50% men and 50% women, is true that the people were selected at random?
22 of the people selected were men and 18 were women. The population random variable has a binomial distribution B(40, π). The null hypothesis is H0: π = .5. Now P(x ≤ 18) = BINOMDIST(18, 40, .5, TRUE) = 0.318. Since .025 < .318 < .975, we can’t reject the null hypothesis with a 95% level of confidence. This, however, doesn’t mean that the sample is random.
We next check to see if the order is random. First, we note that there are 20 runs as follows:
MM FFFF M FF MM F MMMM FF MM F M FF MMMM FF M F MM FF MMM F
Key Property
Before proceeding with the example, we state the key property for conducting a runs test.
Property 1: Suppose there are n1 elements of one type and n2 of the other, where n1 ≥ n2 and n1 is large enough (approximately n1 > 20). Suppose further there are r runs. Then based on the null hypothesis H0 that the order is random, r has an approximately normal distribution N(μ,σ2) where
![]()
![]() Example 1 Continued
Example 1 Continued
Since n1 = 22 > 20, we use Property 1 as shown in Figure 1.
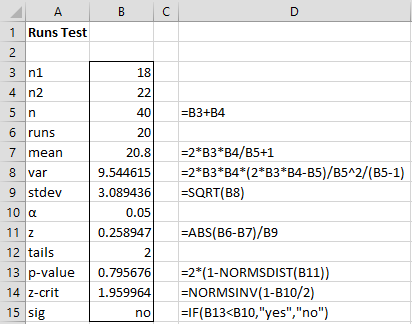
Figure 1 – Runs Test for Example 1
Thus we cannot reject the null hypothesis that the runs are random.
Null Hypothesis and Tails
The above test uses the following null hypothesis
H0: The events in the population from which the sample sequence was drawn are distributed randomly
You use the two-tailed test to test the following alternative hypothesis
H1: The events in the population from which the sample sequence was drawn are not distributed randomly
You use the one-tailed test when (prior to drawing the sample) you can rule out that there are too many runs and so use the following alternative hypothesis.
H1: The events in the population from which the sample sequence was drawn are not distributed randomly (because there are too few runs)
Similarly, you use a one-tailed test with the following alternative hypothesis since you ruled out that there are too few runs.
H1: The events in the population from which the sample sequence was drawn are not distributed randomly (because there are too many runs)
Table Lookup Approach
If n1 ≤ 20, then we can test r by using the table of values found in the Runs Test Table. The range listed for r in the table consists of the values for which the null hypothesis (that the runs are random) is not rejected at the 5% level.
Example 2: Is the order of XXXX ZZ XX Z XXXXXX ZZZ XX Z XXX ZZ random?

Figure 2 – Runs Test for Example 2
We see that n1 = 17 and runs = 10. Since n1 ≤ 20, we need to use the runs table in Runs Test Table. Consulting the runs table we see that runs in the interval [8, 19] are acceptable. Since r = number of runs = 10 is in this interval, we cannot reject the null hypothesis at the 5% level (2-tailed test).
Table Lookup Functions
Real Statistics Functions: The following functions are provided in the Real Statistics Pack:
RLowerCRIT(n1, n2, α, tails) = lower-tail critical value of the runs test for a sample with n1 elements of one type and n2 elements of the other type, where α is the significance level (default .05) and tails = 1 or 2 (default).
RUpperCRIT(n1, n2, α, tails) = upper-tail critical value of the runs test for a sample with n1 elements of one type and n2 elements of the other type, where α is the significance level (default .05) and tails = 1 or 2 (default).
In a two-tailed test, if a = RLowerCRIT(n1, n2, α) and b = RUpperCRIT(n1, n2, α), then the closed interval [a, b] is the range of values for r that satisfy the null hypothesis (that the sequence is random).
Note that if the number of runs r is less than the lower/left critical value then the test for randomness fails due to clustering, while if r is greater than the upper/right critical value then the test for randomness fails due to uniformity.
These functions work for all values of n1 and n2 up to 514, and are based on the runs distribution which is described in Runs Distribution. Note that the values produced by these functions are similar, but not always the same as the values shown in the Runs Test Table.
Runs Test using Real Statistics Functions
Example 3: Determine whether the sequence of numbers in range B3:B17 of Figure 3 is randomly generated.
The approach we use is to turn the sequence of numbers into a sequence of letters of the type shown in the previous examples. We do this by calculating the median of the numbers to be 38 (cell G3 of Figure 3). If an entry in the sequence is greater than the median we code it with the letter A, while if it is less than the median we code it with the letter B. Entries that are equal to the median (e.g. cell B5) are simply ignored. We see the result of this coding in the range D3:D17. For example, cell D3 contains the formula =IF(B3>G$3,”A”,IF(B3<G$3,”B”,””)).
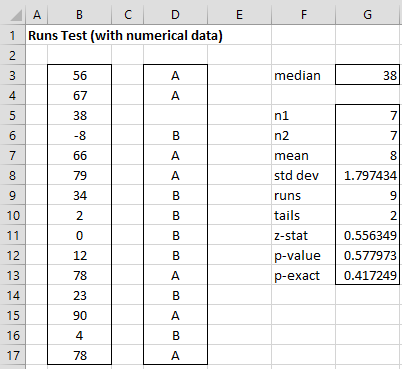
Figure 3 – Runs Test for Example 3
We can now carry out the runs test as demonstrated previously. This time, however, we use the following Real Statistics function to perform the test.
Worksheet Function
Real Statistics Function: The following array function is provided in the Real Statistics Pack:
RUNSTEST(s, lab, tails): outputs a 9 × 1 column range as shown in range G5:G13 of Figure 3 with the results of the runs test on the string s if lab = FALSE (default) and a 9 × 2 range, including labels, as shown in range F5:G13 if lab = TRUE. If tails = 2 (default) a two-tailed test is used and if tails = 1 a one-tailed is used. String s must consist of a sequence of two and only two distinct characters.
RUNSTEST(R1, lab, tails): outputs the results of the runs test on the numeric data in range R1 using the coding described in Example 3; i.e. =RUNSTEST(s, lab, tails) where s is the sequence of codes (ignoring any elements in R1 whose value is the median).
If all the cells in R1 contain one of two one-character symbols (e.g. 4 and *) then RUNSTEST(R1, lab, tails) = RUNSTEST(s, lab, tails) where s is the sequence of symbols in R1. This is the only case where R1 may contain non-numeric values.
Example 3 Continued
The result of the runs test is shown in range F5:G13 of Figure 3, as calculated by the array formula =RUNSTEST(B3:B17,TRUE). Here n1 = the number of elements larger than the median and n2 = the number of elements smaller than the median. The value of runs is 9 since there are 9 runs in the sequence shown in column D. The mean, standard deviation, z-stat, and p-value (cells G7, G8, G11, G12) are based on Property 1 and tails = 2 since this is the default value for the function. The value of p-exact (cell G13) is the p-value based on the exact test using the function =RUNSDIST(r, n1, n2, TRUE), as described in Runs Distribution.
Since p-value > .05 = α (using either the normal approximation in cell G12 or the exact value in cell G13), we cannot reject the null hypothesis that the sequence in range B3:B17 is random.
Note that we would get the same result using either of the following array formulas:
=RUNSTEST(“AABAABBBBABABA”,TRUE)
=RUNSTEST(D3:D17,TRUE)
Further Information
For further information click on any of the following links.
- Runs Distribution for a description of how to carry out an exact one-sample runs test.
- Data Analysis Tools for Non-parametric Tests for how to conduct the one-sample runs test using the Real Statistics Non-parametric Tests data analysis tool.
- Runs using the Binomial Distribution for another approach to carrying out runs tests.
- The Runs Up/Down Test for a related approach to testing for runs
- Runs test with more than two categories (e.g. to test AABCCCBAACA…)
- Two-Sample Runs Test for information about how to extend the one-sample runs test to two samples.
Examples Workbook
Click here to download the Excel workbook with the examples described on this webpage.
References
NIST (2012) Runs test for detecting non-randomness
https://www.itl.nist.gov/div898/handbook/eda/section3/eda35d.htm
Zar. J. H. (2010) Biostatistical analysis 5th Ed. Pearson
Sheskin, D. J. (2000) Handbook of parametric and nonparametric statistical procedures 2nd Ed. Chapman & Hall/CRC
https://psycnet.apa.org/record/2000-08524-000
charles,
I have a data set of 60 employees and asked them about the factors affecting for their turnover and asked to rank those factors from 1-10.
How I analysis these data using which statistical method
Nirosha
Nirosha,
First you need to decide what hypothesis you are trying to test. Then you can decide on the type of statistical analysis that is appropriate for that hypothesis.
Charles
In deed, I want to identify which factor is most important for the turnover based on this listed rank values
Sir
Please examine the following. Running an alpha = 0,05 test. Where N1 = 15 N2= 15, runs = 11, so how about the value in the runs table? i have tried but i’m affraid if the value that I get false (my answer: runs table = 11 – 21). And once again, N1=9 N2= 21, runs =13 (my answer: 9 – 18). In the runs table there are alpha (2)= 0,05 alpha (1) =0,025 and others alpha (2)=0,10 alpha(1)=0,05, so which alpha (2 and 1) is used ? thks
Nur,
The table consists of the critical values for alpha = .05, two-tailed test.
Since the Real Statistics Resource Pack provide RUNSDIST and RUNSINV functions, I actually don’t use the table for testing. Instead I use these functions. In any case, the RLowerCRIT(n1, n2, alpha, tails) and RUpperCRIT(n1, n2, alpha, tails) functions will provide the critical values for any value of alpha, both the one-tailed and two-tailed tests.
This is all described on the website (see bottom of the referenced webpage).
Charles
Sir
Please examine the following. Running an alpha = 0,05 test. Where N1 = 15 N2= 15, runs = 11, so how about the value in the runs table? i have tried but i’m affraid if the value that I get false (my answer: runs table = 11 – 21). And once again, N1=9 N2= 21, runs =13 (my answer: 9 – 18). In the runs table there are alpha (2)= 0,05 alpha (1) =0,025 and others alpha (2)=0,10 alpha(1)=0,05, so which alpha (2 and 1) is used ? thks
Thanks a lot Charles for your effort despite your busy schedule!
Hi Charles,
Thanks for your reply! I have checked out the paper you referenced and what I found is disappointing. The authors barely gave the proof for the normal approximation – for example, they mentioned that they would obtain E[U] by “performing several summations of the type[…]” and then followed by expression (9). However, it appears that expression (9) is just a part of the complete form of expectation expression. It then ignores the rest and jumped through a couple of hoops without giving any proofs, reasoning that “it is easy to verify” them. It is interesting comment since what is easy for them seems impossible for me.
For the variance, it’s even worse: they did not even mention what did they start with, and what is the process of derivation. Instead, a direct result is presented without any proof.
Therefore, I would really appreciate if you can provide some proofs here, as your proofs are the only one on the internet that’s so concise and clear!
Thanks again!
Eugene
Eugene,
Sorry that it didn’t work out. I am too busy at present to try to figure out the proof, but I’ll try to see if I can find a proof that someone else created and if necessary try to make it clearer.
Charles
Hi Charles,
I am wondering can you give the proof for the normal approximation for runs test, just as you did for rank-sum and signed-rank tests?
Thanks!
Eugene
Eugene,
This proof can be found in the following paper:
Wald, A. and Wolfowitz, J. (1940), “On a test whether two samples are from the same population,” Ann. Math Statist. 11, 147-162.
You can download a copy from the webpage:
http://projecteuclid.org/download/pdf_1/euclid.aoms/1177731909
Charles
Dr. Charles Zaiontz,
In Non-parametric Tests, One Sample Runs Test, I do not have a figure showing for “Figure 1 – Runs Test for Example 1”. The figure was apparently there previously since it is mentioned in one of the comments.
Thank you for all the material and effort you have put into the website.
Robert
Robert,
Thanks for letting me know that Figure is missing. I have now added the figure to the webpage.
Charles
Hi, in the example above (n1=17, n2=9), you give the critical bounds as (9,18); however, the runs test table for the same n1 and n2 give the bounds (8,19). Furthermore, when I try to run this test in excel using the Real Statistics Supplemental Data Analysis Tools, i get the bounds (8,17). Why are there so many discrepancies, and which one is actually correct?
Thanks for your help.
Christopher
Christopher,
The bounds (9, 18) are not correct. The example was changed a long time ago, but for some reason the image was not changed. I have now corrected this on the website. The correct values from the table are [8, 19].
The Real Statistics tools calculate values based on the Runs Distribution, as described on the website. I am not sure why these values differ from the table values. I am inclined to trust the Real Statistics values more, but I need to check one thing, namely does the lower bound give the first value for which the null hypothesis is not rejected or the last value where the null hypothesis is rejected on the left side (and similarly for the upper bound).
Thanks again for finding the error and for asking your question.
Charles
Charles,
1) I first wish to respond directly to your last post. It would appear that you and I have a different understanding for the term “p-value.” But in my understanding of the concept of p-value, if you compare your probability calculation labeled “p-value” to alpha/2, then you are calculating half of the p-value, not the actual p-value. I’ll come back to this point below.
2) Regardless of my disagreement with your terminology in (1), note that in your table, your calculation is not consistent with your explanation. Note that in Line 14, your test asks if B12<B10, not B10/2. So I think your algorithm would still yield the contradiction that I described in my previous post.
3) Back to (1): We know that p-value carries a number of different interpretations and explanations. One such explanation is that the p-value represents the smallest alpha level for which the observed data could reject the null hypothesis. Your calculation and labeling of p-value is not consistent with this notion. Further note that when a p-value for a two-sided test is reported in statistical software, such as Minitab, it will be double what you are reporting, not the value you offer.
I hope my comments make sense.
James
Charles,
With a two-tailed test (as indicated by using alpha/2 in calculating the critical value), should the upper tail probability from the normal distribution be doubled to get the p-value for the test?
James
James,
For a two tailed test either you double the p-value or take half of alpha, but you shouldn’t do both. I chose to halve the value of alpha.
Charles
Charles,
Please examine the following: Consider running an alpha=0.05 test. Suppose we observe a test statistic value of z=1.90. Using alpha/2 leads to z-crit=1.959964, as you have written, and we would fail to reject the null hypothesis. However, using 1-NORMSDIST(z) to obtain the p-value yields 1-NORMSDIST(1.90)=0.02871656, a value less than 0.05, indicating that we should reject the null hypothesis, which is a contradiction.
Using 1-NORMSDIST(z) for this setup of the two-tailed test finds half of the p-value.
James
James,
In the second case you would compare not with alpha = .05, but with alpha/2 = .025. This is the common approach (assuming that I am understanding your comments properly).
Charles