Basic Approach
For any value x, we can calculate a predicted value y-hat for y corresponding to x via the formula
![]()
We can then calculate the standard error for this prediction using the jackknifed procedure described in Jackknifing. This is shown in Figure 1 for the value x = 6.
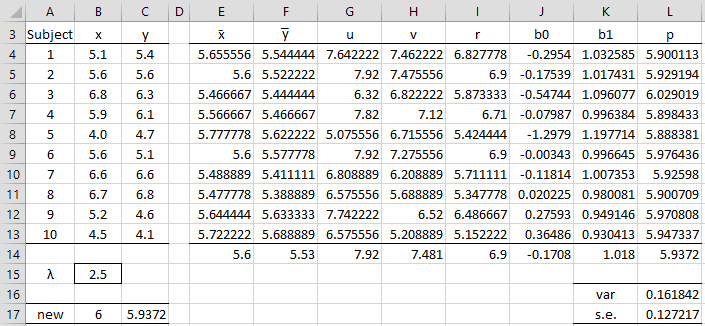
Figure 1 – Deming regression prediction
Here, the E through K columns are calculated as in Figure 1 of Jackknifing. Cells L14 and C17 contain the formula =J14+$B$17*K14 and cell L4 contains the formula =J4+$B$17*K4. Cell L16 contains the formula =DEVSQ(L4:L13)*(A13-1) and cell L17 contains =SQRT(L16/$A$13).
Worksheet Functions
Real Statistics Functions: For array or range R1 containing X values and R2 containing y values, we have two forms of the following array function. The first corresponds to data as in Example 1 of Deming Regression Basic Concepts where lambda is known and the second where lambda is calculated from the data as in Example 2 of Deming Regression Basic Concepts.
DRegPred(x0, R1, R2, λ, alpha, lab) = 4 × 1 array consisting of the predicted value of y corresponding to x0, the standard error for this prediction and the lower and upper ends of a confidence interval for this prediction based on the Deming regression on the data in R1 and R2 where lambda = λ.
DRegPred(x0, R1, R2,, alpha, lab) = DRegPred(x0, R3, R4, ) where R3 consists of the averages of the X data measurements in R1, R4 consists of the averages of the Y data measurements in R2 and the λ is calculated as in Example 2.
If lab = TRUE (default FALSE), then an extra column is appended to the output from DRegPred with the labels “pred”, “s.e”, “lower” and “upper”. alpha is the significance level, which defaults to .05 if omitted.
For the Deming regression described in Example 1, the table on the left of Figure 1 shows the predicted values of y corresponding to all the values of x in the original sample. For example, the prediction for the first data element is shown in range D6:G6 using the following array formula:
=TRANSPOSE(DRegPred(B6,$B$6:$B$15,$C$6:$C$15,$B$17))
Similarly, we can calculate predictions for values of x not in the original sample as shown on the right side of Figure 2. E.g. the prediction for x = 6 is shown in range L6:L9 using the formula
=DRegPred(L5,$B$6:$B$15,$C$6:$C$15,$B$17,$B$18)
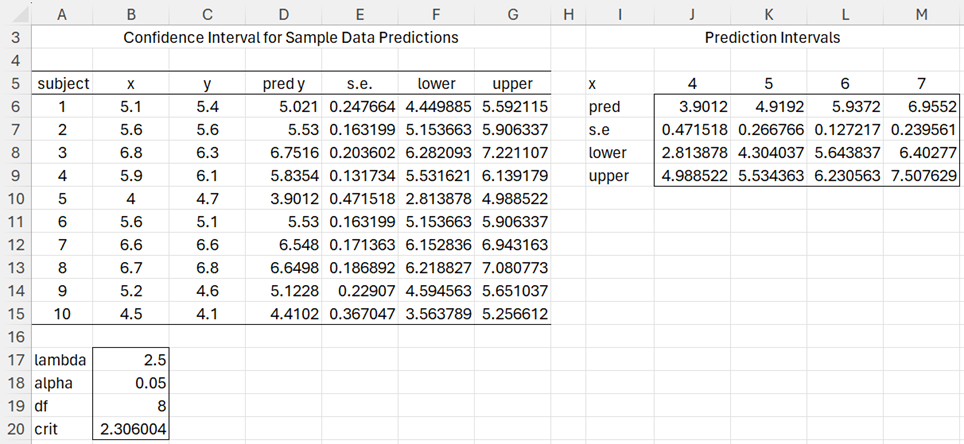
Figure 2 – Predictions using Real Statistics
Examples Workbook
Click here to download the Excel workbook with the examples described on this webpage.
Reference
NCSS (2016) Deming regression
https://www.ncss.com/wp-content/themes/ncss/pdf/Procedures/NCSS/Deming_Regression.pdf
Greetings Charles,
Your website and resource packs are an amazing resource – thank you!
I noticed that when I applied the DRegPred function to the sample data shown in Figure 2, I obtained slightly different values for the lower and upper prediction intervals. Since the pred and s.e. values matched, I worked backwards and found that the t critical value being used was not 2.306004, but was actually 2.262157. Coincidentally, this is the t value you would obtain from the T.INV.2T function when alpha = 0.5, and the DF = 9 (as opposed to 8 which is used in Figure 2). Can you help me understand why the function uses n-1 for the DF in the calculation? Thank you for helping me with this.
Hi Larry,
Let’s look at cell F6. We expect that value to be pred – crit * se = 5.021 – 2.306004 * .247664 = 4.449886, which is the value that appears in cell F6 (except for the last digit, probably due to roundoff error). The value in cell G6 is a match as well.
I did change df from n-1 to n-2 recently (although there is some disagreement as to which is the better estimate), but I thought that I changed the output to reflect this change. Perhaps you are using an earlier version of the Real Statistics software where n-1 was used instead of n-2.
Charles
That’s it! – I was using a old version.
I just downloaded and installed the current version of the Real Statistics software and now everything matches.
Thank you for your assistance.
Hello Charles, can you be able to calculate deming regression using only two data set with unknown variance, as in the case of doing comparison between to different instrument platform with the same operation principle? See the below data set and advice further
No. X Y
25B 5.12 4.92
29B 4.17 4.24
30B 2.12 2.38
31B 1.88 2.16
33B 1.69 2.19
34B 2.70 3.07
35B 4.08 4.52
36B 2.00 2.16
38B 3.84 4.12
39B 5.90 6.05
40B 3.39 3.67
41B 5.80 6.24
42B 4.99 5.09
43B 5.21 5.36
44B 3.61 3.71
46B 1.70 2.13
47B 1.74 1.95
48B 3.29 3.70
49B 3.76 4.21
50B 1.71 1.63
51B 2.90 3.36
52B 4.48 4.89
53B 1.61 1.64
57B 4.36 4.64
58B 4.81 4.64
59B 4.85 5.08
60B 3.46 3.48
61B 3.82 3.73
62B 2.28 2.56
63B 4.15 4.57
45B 2.56 1.47
Hello Fred,
You need to manually supply an estimate for lambda.
Charles
Hello Charles, trying to apply the deming regression and seems am having challenges. I am working on comparison verification analysis of two machines, and feeding the two data set I have ain’t giving me good feedback, kindly advice or share your email i forward you the data points for more clarification being its my first time experience.
Dear Charles,
I’ve been working on reproducing an example of Deming regression. It’s two graphs, comparing Method A vs Method B and Method A vs Method D.
I estimate the prediction intervals using the equations above (DRegPred) for values of x not in the original sample, as shown in Figure 2.
I also used the option of Confidence/Prediction Interval of the Add-In tool, that generate a graph of confidence interval and a graph of prediction interval.
What happened is that the confidence interval graph obtained from the tool shows better agreement with the graph I already have (with deming regression and prediction lines) than the graph I construct with the output of the equation DRegPred, that looks more a confidence interval, than a prediction interval, because it is narrower.
So, I wonder if DRegPred wouldn’t be calculating the confidence interval instead of the prediction.
Regards,
Waldemar
Hello Waldemar,
I based this webpage on the following resource:
https://www.ncss.com/wp-content/themes/ncss/pdf/Procedures/NCSS/Deming_Regression.pdf
In that paper, they call it a confidence interval.
Charles
Charles,
I see.
So, in fact we obtain the predicted Y, but obtain the confidence intervals.
I guess I’ll be using the Add-In option for Confidence/Prediction Intervals then.
Thanks.
Waldemar
If you are referring to the Confidence/Prediction Interval Plots, this is for ordinary linear regression.
Charles
Yes, that’s what I’m referring to. It would be nice to have the same tool option, of Confidence/Prediction Interval Plots for the Deming Regression.
I need the wider Prediction Interval bands to evaluate the commutability of two reference materials, after plotting the Deming regression line.
Waldemar
I will look into this issue sometime in the future. I need to find a reference that clearly shows the different formulas for computing the prediction and confidence intervals.
Charles
I am trying to understand how the calculations work for weighted Deming regression. Is there an example of these calculations in an excel spreadsheet that you can point me to? Thanks for the website!
Hello Stephen,
Glad that you like the website.
The website doesn’t yet support the weighted version of Deming regression.
Perhaps the following webpage will be helpful:
https://ncss-wpengine.netdna-ssl.com/wp-content/themes/ncss/pdf/Procedures/NCSS/Deming_Regression.pdf
Charles
Hi Charles,
I had a quick question about the prediction interval. Your formula above for the s.e. is sqrt(var/N) but isn’t this for a confidence interval? Isn’t the standard error calculated as sqrt(var + var/N) OR stdev*sqrt(1+1/N) for a prediction interval?
I calculated the standard error from Figure 1, with sd = sqrt(0.16184) as:
0.4023*sqrt(1+1/10) = 0.4219
Have I got this wrong?
Thanks,
Kieran
Kieran,
What you are saying makes sense to me, but the source that I used gave the formula for the confidence interval that I used on the website without the “one”. I have been trying to check this, so far without any success. I will continue to investigate this. Sorry for the delay.
Charles
Hi Charles,
How do I calculate the variances for x and y? I’m. not getting the same result as shown
Chau,
What values are you calculating for the variances of x and y? What value values do you see on the webpage for the variances of x and y?
Charles
Does figure 2 show the confidence interval for the predicted mean at a given Xo? Assuming yes, how does one calculate the prediction interval at a given X0? I would think the standard error calculation would be slightly different.
Sarah,
I believe that these are the prediction intervals and not the confidence interval for the mean.
Charles
Thanks Charles. What is the standard error calculation for the Confidence Interval of the mean? Would you be able build on this example to show how to determine the confidence interval of the mean?
Sarah,
The following webpage explains the confidence interval for the slope and intercept
https://real-statistics.com/regression/deming-regression/jackknifing/
I am not sure what you mean by the confidence interval of the mean.
Charles